
- Solve real problems with our hands-on interface
- Progress from basic puts and calls to advanced strategies
Interactive Options Course

Posted September 5, 2025 at 10:00 am
In a previous article, I summarized why insurance companies, municipalities, utilities, or other organizations with broad hurricane exposure in specific coastal regions might consider taking a YES position on major hurricane landfall Forecast Contracts, as it can act as a hedge on risk analogous to parametric insurance.
I have also explored how these risk hedgers may bid up the price of YES positions above their true actuarial value (but still below the price of alternative parametric insurance), which would entail that NO positions offer a positive expected return. In this case, adopting a NO position on hurricane Forecast Contracts can benefit an investment portfolio by boosting diversification and thus lowering downside risk.
A critical aspect of the portfolio analysis in the previous article was the correlation of annual-level hurricane risk across multiple regions. Taking the NO position becomes more attractive when the investor can be sure that they are very unlikely to lose a large fraction of their investment. In that previous article, I assumed certain correlations of hurricane strikes across different regions, particularly the chances of multiple hurricanes making landfall in separate counties within one season.
In the analysis below, I explore the actual historical probabilities of simultaneous hurricane landfalls in multiple defined regions in a single year, based on 124 years of historical data (1900-2024) from the HURDAT2 dataset. The overarching goal of this analysis is to investigate how diversifying across geography in the form of taking NO positions in several regions simultaneously affects the overall performance of the NO investment and, in particular, its downside risk.
I conduct this analysis using ForecastEx’s ten regional major hurricane (Category 3, 4, and 5) landfall Forecast Contracts shown below. These regions were created to be geographically meaningful (i.e., coherent regions), to contain sufficient population/value such that entities would be interested in taking the YES postiion to hedge risk, to have meaningful major hurricane risk, and to be mutually exclusive (a single hurricane landfall cannot trigger multiple contracts, although a hurricane can make landfall more than once and activate multiple contracts).
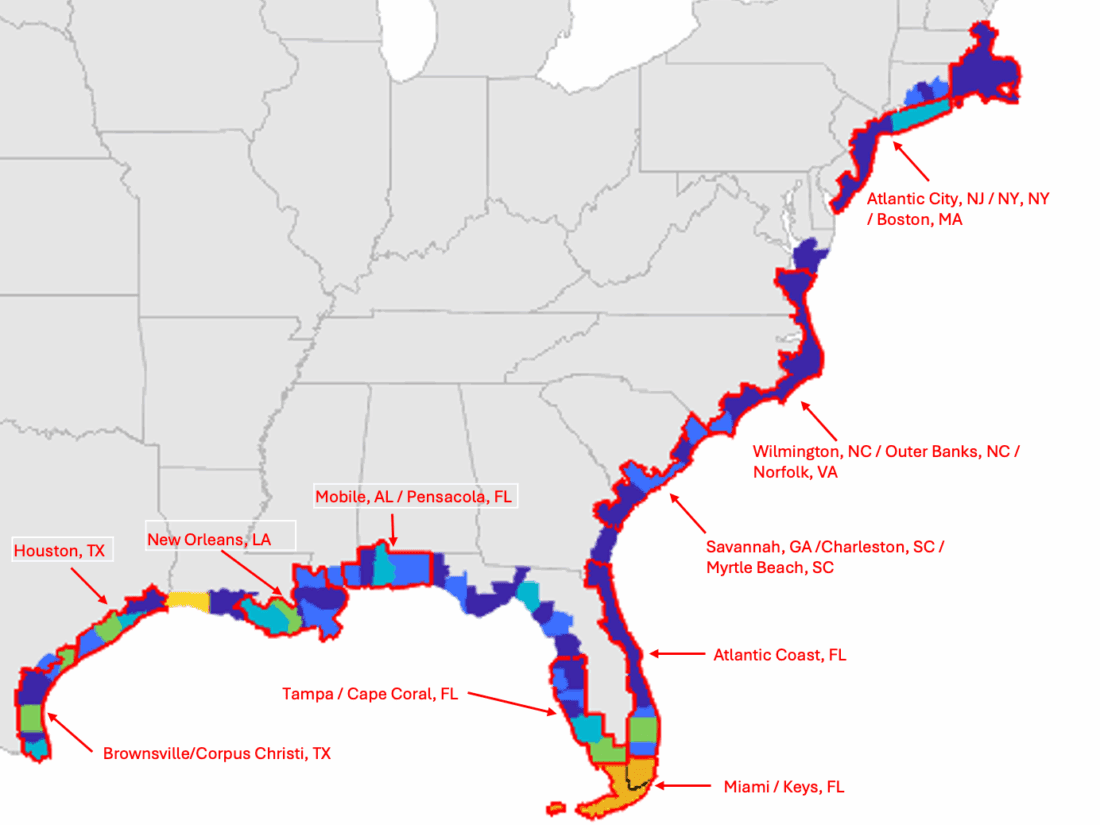
The ten regions (ten Forecast Contracts) utilized in this analysis. Produced using MATLAB.
Even with 124 years of data, major hurricanes are relatively rare, especially for any particular region. This means that the sample of the past 124 years is likely to be quite noisy and may not be statistically representative of the “true” probabilities of hurricane landfalls. For example, if there are two adjacent counties with similar shoreline orientations and lengths but one county has been struck by four major hurricanes since 1900 while its neighbor has been struck by two, the empirical probability estimate would suggest that the former county has twice the risk of the latter when that really just represents an accident of history.
Thus, to conduct an analysis on data less contingent on the particularities of history, I increase the sample by generating 1,000 hypothetical synthetic years for each year in the historical dataset. A synthetic year is created by randomly nudging each historical landfall in that year by both its location and its intensity while preserving the total number of landfalls in that year (though the number of major hurricane landfalls can change because intensity is altered). Landfall locations are perturbed using a Gaussian distribution with a one-degree standard deviation, and intensities are resampled from an empirical distribution where draws favor staying near the original category but allow for variation (upgrades are less likely than downgrades) in proportion to their empirical rates. This approach samples over one hundred thousand years that “could have been” (had a butterfly flapped its wings differently), while preserving features such as annual ebbs and flows in basin-wide hurricane activity and covariations of activity between regions.
The frequency maps below illustrate the county-level difference in major hurricane risk between the historical record (1900-2024) and the full dataset, which includes over one hundred thousand plausible but unrealized years. The main effect of the synthetic dataset is simply to smooth out the historical probabilities across adjacent counties.
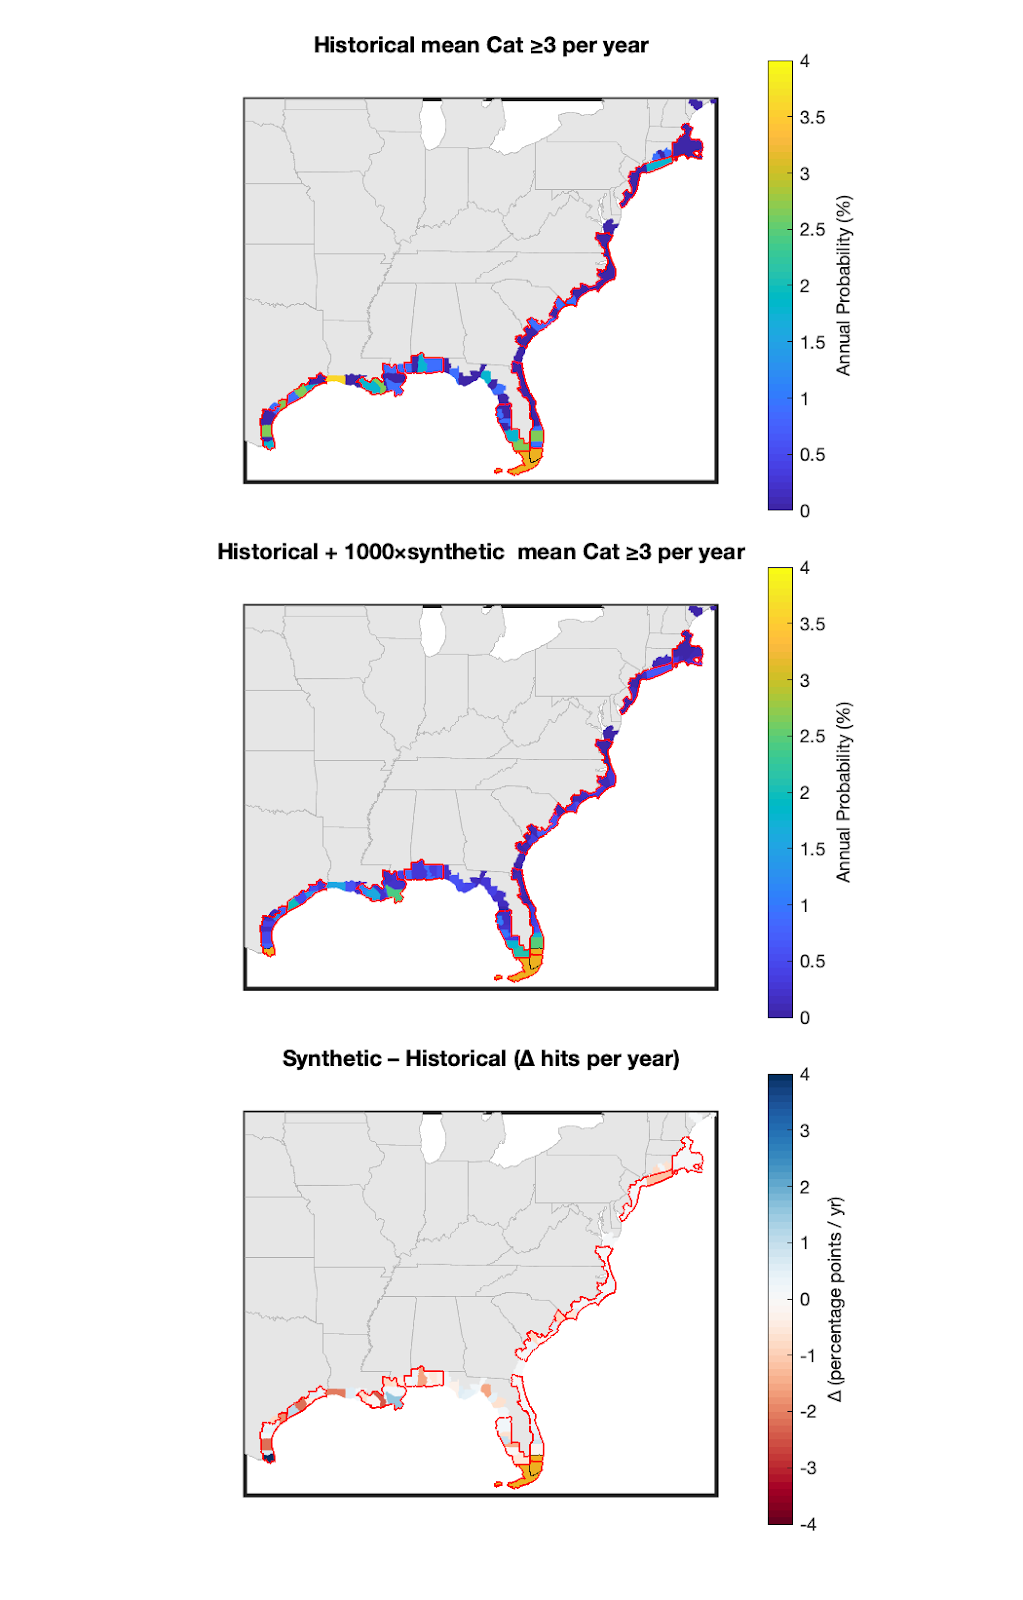
Comparison between the county-level major (Category 3+) hurricane risk in the historical record (1900-2024) and the full dataset that includes over 100,000 plausible but unrealized (synthetic) years. Figure produced in MATLAB.
Using the full synthetic landfall dataset, we can assess the regional average probabilities of landfall for the ten regions labeled in the map above. Each bar below is the annual probability that a region experiences at least one major hurricane landfall in a single season (so, the complement of the NO probability).
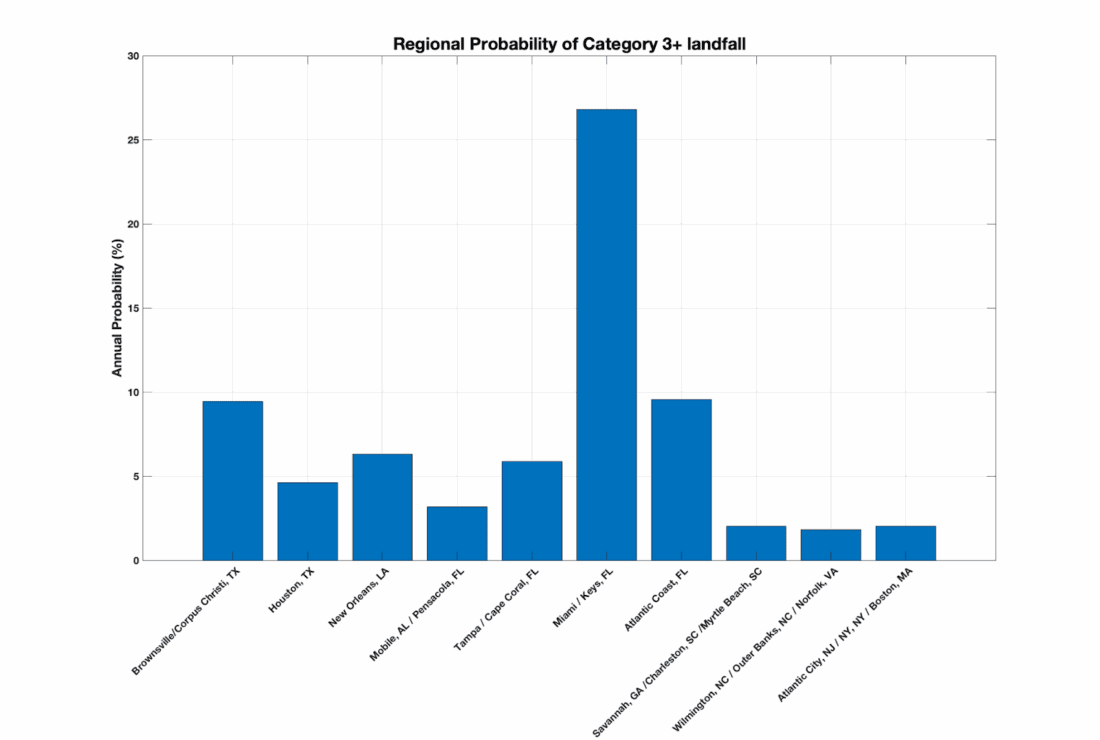
Annual probability that a region experiences at least one major hurricane (Category 3 or higher) landfall in a single season, where landfall is defined as the hurricane eye intersecting the coast in one of the counties that make up the region. Figure produced in MATLAB.
The Miami/Keys (FL) region sits far above the rest (about 27% annual odds), even though it is made up of only two counties (Miami-Dade and Monroe). The next tier of regions, with a 5% to 10% chance per year each, is comprised of the Florida Atlantic Coast, Tampa/Cape Coral (FL), New Orleans (LA), Brownsville/Corpus Christi (TX), and Houston (TX) regions. Mobile/Pensacola (FL) is at around 3% while the northern sites of Savannah/Charleston/Myrtle Beach, Wilmington/Outer Banks/Norfolk, and Atlantic City / NY / Boston come in lowest, at around 2% chance per year each (The North Carolina Coast is a hotspot for tropical cyclone landfall, but not necessarily major hurricane landfall).
A key point that emerges from this is that major hurricane landfalls are relatively unlikely for any particular region. As a result, experiencing multiple landfalls across different regions in one year is generally quite uncommon.
Using the synthetic landfall dataset, I can estimate the likelihood that multiple regions will experience a major hurricane landfall in the same year (what I refer to as co-hit risk). Below is a heatmap that shows the pairwise probability of co-hits across all ten regions.
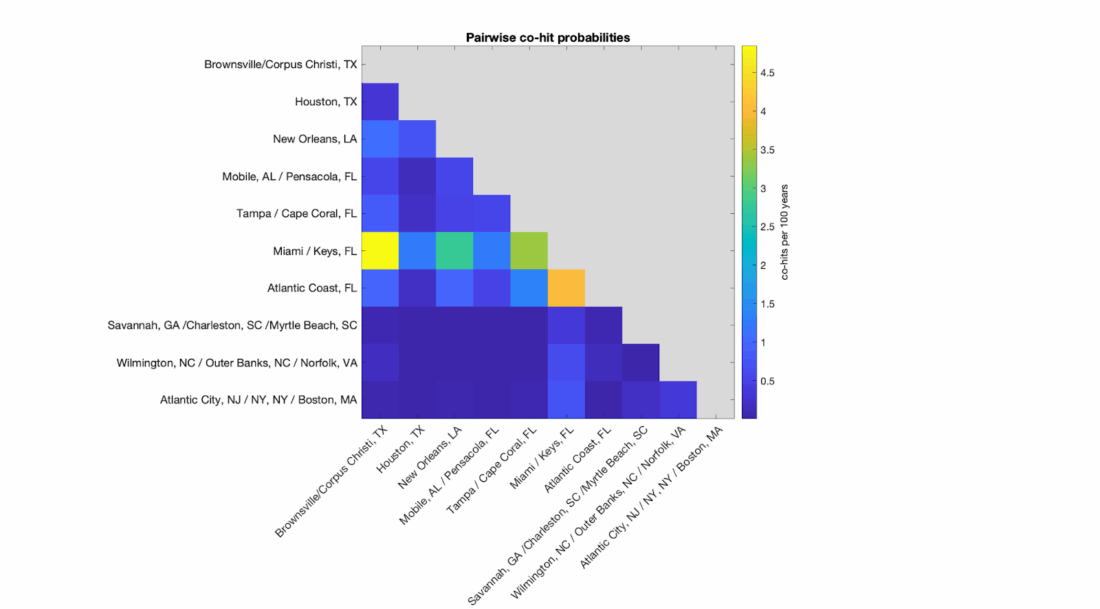
Probability that a major hurricane hits both regions (on horizontal and vertical axes) in the same year, expressed as co-hits per 100 years or equivalently as an annual percent chance. Figure produced in MATLAB.
Most cells are deep blue, indicating co-hit probabilities well below 1% per year. Long-range combinations such as Texas with New England or the Carolinas have particularly small co-hit probabilities.
The highest values are associated with the Miami / Keys region co-hitting with other regions in the Gulf or the Atlantic Coast of Florida. These regions tend to share both sea surface temperature anomalies and an atmospheric environment that should make their landfall probabilities co-vary with each other. The Miami/Keys region paired with the Brownsville / Corpus Christi region shows the highest co-hit probability, reaching 5 per 100 years (roughly 5% chance of both experiencing a major hurricane landfall in the same year).
The map and bar chart below display the average co-hit rate of each region with the other nine regions.
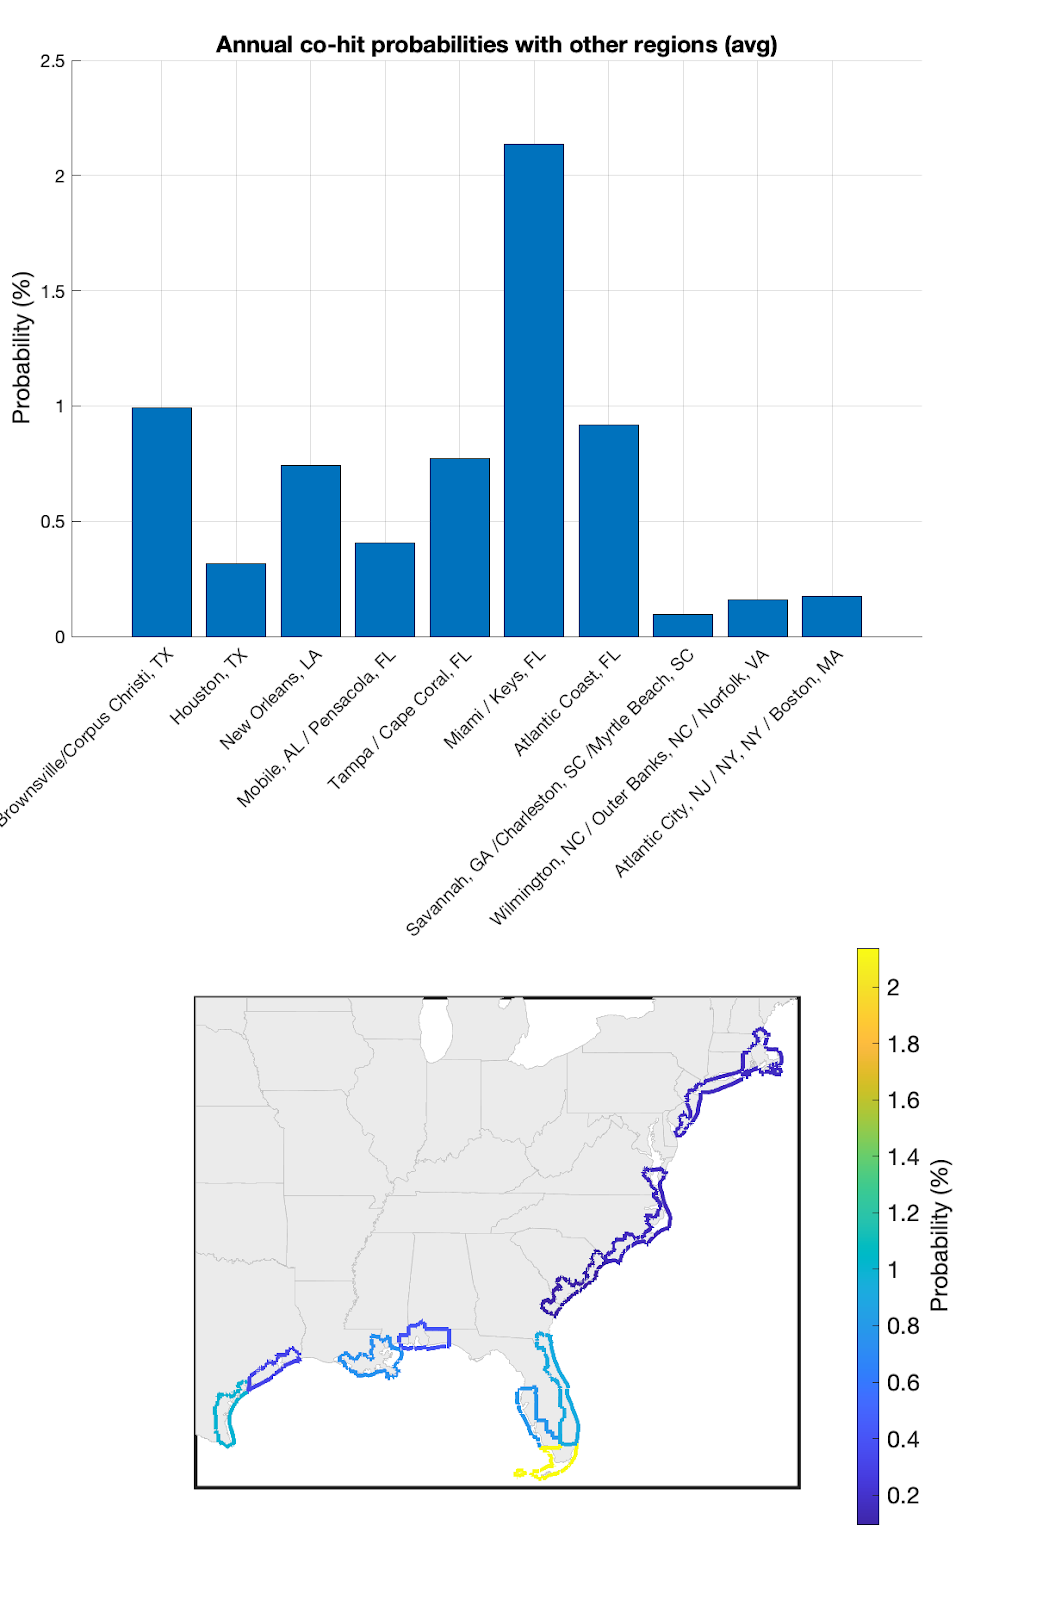
The rate at which each of the ten regions co-hits with each of the nine other regions, averaged across the nine other regions. Figure produced in MATLAB.
The Miami/Keys region has the highest average co-hit rate with other regions at roughly 2%. This is partially because overall hurricane activity is correlated between South Florida and other regions. However, these co-hit figures look a lot like their analogous figures above that expressed the local risk for each region. Thus, the co-hit probabilities mostly reflect local risk (if a hurricane is more likely to hit a given region, that inherently makes it more likely that a hurricane will hit that region and another region in a year).
With co-hit probabilities in hand, I can assess the overall performance and downside risk of investments on the NO side of major hurricane landfall Forecast Contracts (which pay $1.00 if a major hurricane does not make landfall in a given region but are worth $0.00 when a hurricane does make landfall). The idea is that, to minimize the downside risk of a NO portfolio, several regions can be invested in simultaneously, making it less likely that a substantial portion of the NO portfolio would become worth $0.00 in a single year.
The positive expected return of these investments emerges from the idea that those seeking to hedge risk would bid YES prices higher than their true actuarial value, reflecting a risk premium they are willing to accept in exchange for the hedge. This would consequently cause NO prices to become undervalued or to ‘go on sale’ relative to their true actuarial value.
Thus, purchasing a suite of undervalued NOs that have relatively low co-hit probabilities would provide a way to achieve positive returns that are likewise uncorrelated with mainstream equities or bonds (hurricane occurrence is unrelated to the business cycle).
I simulate the results of a $10,000 investment in NO contracts in all the years in the historical plus synthetic dataset. I assume an edge (mispricing) on NOs of $0.05. I also add the 3.83% incentive coupon paid on the collateral to get expected returns.
I analyze outcomes as a function of the number of regions included in the investment, specifically looking at scenarios with one region, five regions, and all ten regions.
In the case of one region, I show results averaged across all regions. In the case of five regions, I show results averaged over all possible five-region combinations drawn from the ten (the “10 choose 5” combination set). In the case of ten regions, there is only a single possible package of all ten regions.
I suppose investments in the same number of NO contracts in each region of a bundle. Because region prices (odds) differ, the dollar spent per region varies proportionally with price.
Finally, I make the simplifying assumption that there can be only one set of contract purchases per region per year and one major hurricane per region per year. Contracts are also assumed to be held for a full year, so the full annual 3.83% incentive coupon is realized on the collateral. Finally, there are no dynamic market price changes either within the year or between years.
The results are summarized in the figure below. The top panel displays the true actuarial value of NOs ($0.93, black) compared to the amount the investor pays ($0.88, green) as a function of the number of regions included in the NO size. These prices reflect the average probability of NOs across all regions. This panel highlights that these prices are the same for all bundle sizes because each region gets sampled equally.
The middle panel displays the average return (bar height) on the $10,000 investment across all years, along with the 1st to 99th percentile uncertainty range (whiskers), as a function of the number of regions included in the NO bundle.
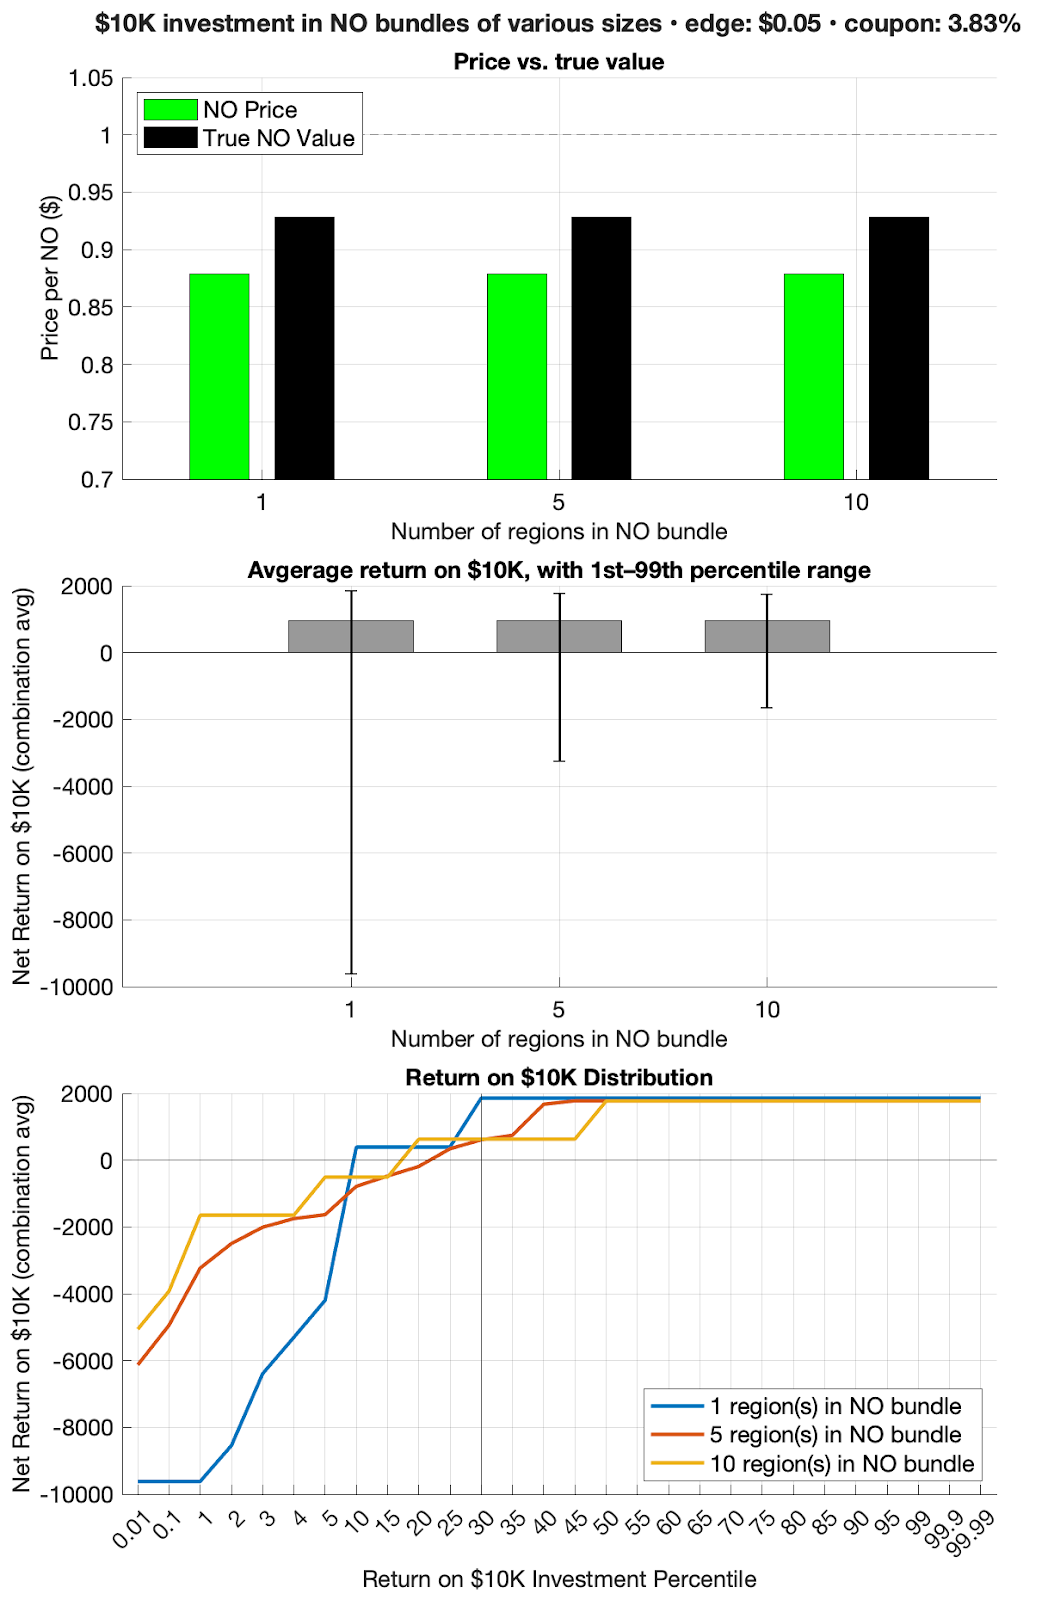
Performance of a $10,000 annual NO investment built from bundles of 1,5, and 10 regions. Top: Average market price paid per NO (green) versus its true actuarial value (black). Prices embed a $0.05 edge or risk premium; the dashed line marks $1.00. Middle: Mean net return on the $10k (gray bars) with error bars showing the average 1st–99th percentile range across all combinations of regions and across years; returns include the risk premium, the 3.83% coupon, and are net of cost. Bottom: Distribution of annual net return (average per-combo quantiles). Increasing the bundle size leaves the mean return roughly unchanged but tightens the left tail (i.e., downside risk falls as regions are diversified) while upside remains capped near coupon plus risk premium. Figure produced in MATLAB.
The average return on the $10,000 investment is around $950 for each bundle size or 9.5%. This arises because the assumed edge (risk premium implicitly offered by YES buyers) is $0.93/$0.88 = 5.7%, and there is an annual incentive coupon of 3.8%. Therefore, the total average return is around 5.7% + 3.8% = 9.5%.
The largest possible return occurs when all NOs come to fruition and are worth $1.00 after the year ends. In other words, it occurs when a major hurricane does not strike anywhere in the bundle in that year. For a $10,000 investment, that return is around $1,800 (18%) for each of the bundle sizes (top whisker in the middle panel and rightmost values in the bottom panel. This arises because $1.00/$0.88=14%, and the incentive coupon is 3.8%, so 14% + 3.8% = ~18%.
Although the upper end of the returns remains consistent across bundle sizes, the lower end (1st percentile) increases substantially (i.e., major loss risk decreases) as the bundle size increases. This is also seen in the bottom panel, where the 1st percentile loss is worst in the 1-region bundles, followed by the 5-region bundles and then the 10-region bundle.
The maximum loss occurs when all the contracts in a bundle resolve to $0.00 or a hurricane hits all the regions in a bundle. In the case of a “bundle” of a single region, this just means that a major hurricane hit the single region, which occurs in about 7% of the years (averaged across the regions). In this case, we assume the incentive coupon is still realized. Thus, the $10,000 investment is lost, but with the coupon earnings, the result is around -$9,600.
The 5-region and 10-region NO bundles would require all regions in the bundle to experience a major hurricane landfall to reach this maximum loss of -$9,600. A major hurricane only makes landfall in any location in the United States about once every two years on average, so the likelihood that five major hurricanes make landfall in each of five regions in a bundle in a single year is vanishingly unlikely, and chances are effectively zero in the case of ten regions. This is reflected in the first percentile return (typical worst return in 100 years), which moves from -$9,600 with a bundle size of one region to -$3,200 for a bundle size of five regions, and then to -$1,600 for a bundle size of ten regions.
One important asymmetry is that when baseline NO odds are high (and thus prices of NOs are high), the return associated with any given region resolving to $1.00 (i.e., NO, a hurricane did not occur in that region) is much smaller than the loss that would be incurred from that region resolving to $0.00 (i.e., a hurricane did occur). Thus, even with bundles of five and ten regions, any single NO in a bundle resolving to $0.00 causes major damage to the investment’s overall returns.
This can be seen in the following table, which simplifies the math by assuming each region has the average probability of all the regions, Prob(NO)=0.93.
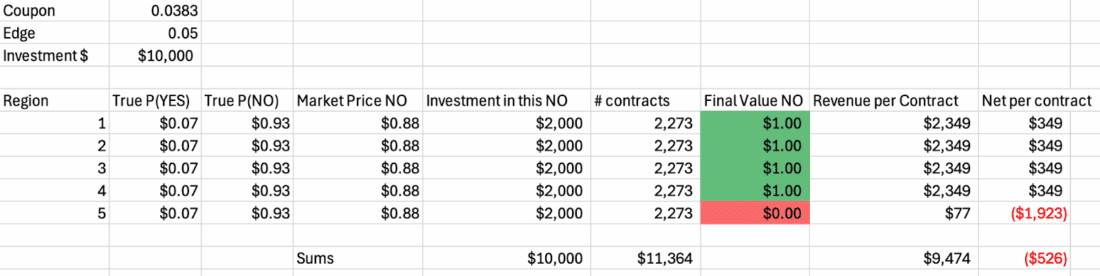
Table produced in Excel.
With five regions, $10,000 is allocated as $2,000 per region. If a hurricane does not occur in four out of five regions, the total return from those four regions is 4×$349=$1,396. However, the region where a hurricane strikes causes a loss of $1,923, resulting in a net loss of $526 for the entire bundle.
With ten regions, $10,000 is allocated as $1,000 per region. If a hurricane does not occur in nine out of ten regions, the total return from those nine regions is 9×$175=$1,575. However, the region where a hurricane strikes causes a loss of $962, resulting in a still positive return but only $610. If two out of ten regions experience a hurricane, then the result is equivalent to one out of five above, and the bundle results in a net loss of $526.
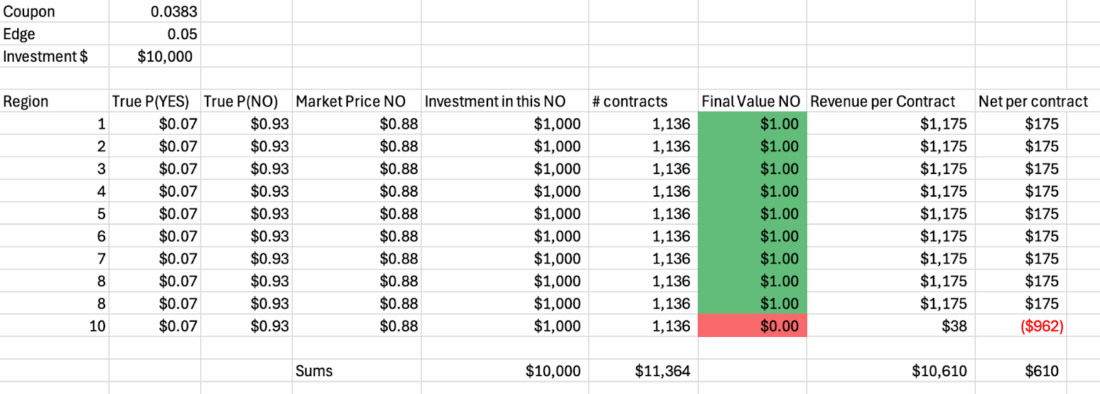
Table produced in Excel.
The lowest panel in the figure above, which shows net return as a function of quantiles for each bundle size, also illustrates this dynamic. As you move from the highest percentiles (right) toward the middle of the distribution, the 10-region line is the first to bend down, then the 5-region line, and finally the 1-region line. This is because the probability that at least one of the regions in a bundle getting hit rises with the number of regions.
Overall, bundling more regions together does not change the annual expected return of a portfolio of NO positions on major hurricane landfalls. These landfalls are infrequent, and thus the odds for concurrent landfalls in multiple regions are quite small even in active years across the basin. Unfavorable years for NO investors occur when one or more regions in the bundle are hit, and there is a tradeoff in that each region added to a bundle drastically reduces the chance that all regions will be hit, but it slightly increases the chance that a single region will be hit. In other words, a NO portfolio of more regions is slightly less likely to have a perfect year, but also far less likely to have a catastrophic year.
New to Prediction Markets?
Open a Prediction Markets AccountThe analysis in this material is provided for information only and is not and should not be construed as an offer to sell or the solicitation of an offer to buy any security. To the extent that this material discusses general market activity, industry or sector trends or other broad-based economic or political conditions, it should not be construed as research or investment advice. To the extent that it includes references to specific securities, commodities, currencies, or other instruments, those references do not constitute a recommendation by IBKR to buy, sell or hold such investments. This material does not and is not intended to take into account the particular financial conditions, investment objectives or requirements of individual customers. Before acting on this material, you should consider whether it is suitable for your particular circumstances and, as necessary, seek professional advice.
The views and opinions expressed herein are those of the author and do not necessarily reflect the views of Interactive Brokers, its affiliates, or its employees.
Interactive Brokers LLC is a CFTC-registered Futures Commission Merchant and a clearing member and affiliate of ForecastEx LLC (“ForecastEx”). ForecastEx is a CFTC-registered Designated Contract Market and Derivatives Clearing Organization. Interactive Brokers LLC provides access to ForecastEx Forecast Contracts for eligible customers. Interactive Brokers LLC does not make recommendations with respect to any products available on its platform, including those offered by ForecastEx.
This is commentary on economic, political and/or market conditions within the meaning of CFTC Regulation 1.71, and is not meant provide sufficient information upon which to base a decision to enter into a derivatives transaction.
Related Articles


")


Join The Conversation
For specific platform feedback and suggestions, please submit it directly to our team using these instructions.
If you have an account-specific question or concern, please reach out to Client Services.
We encourage you to look through our FAQs before posting. Your question may already be covered!