- Solve real problems with our hands-on interface
- Progress from basic puts and calls to advanced strategies
Interactive Options Course
Posted August 26, 2025 at 9:30 am
From SIA Charts
1/ Roblox Corp. (RBLX)
2/ Candlestick Chart
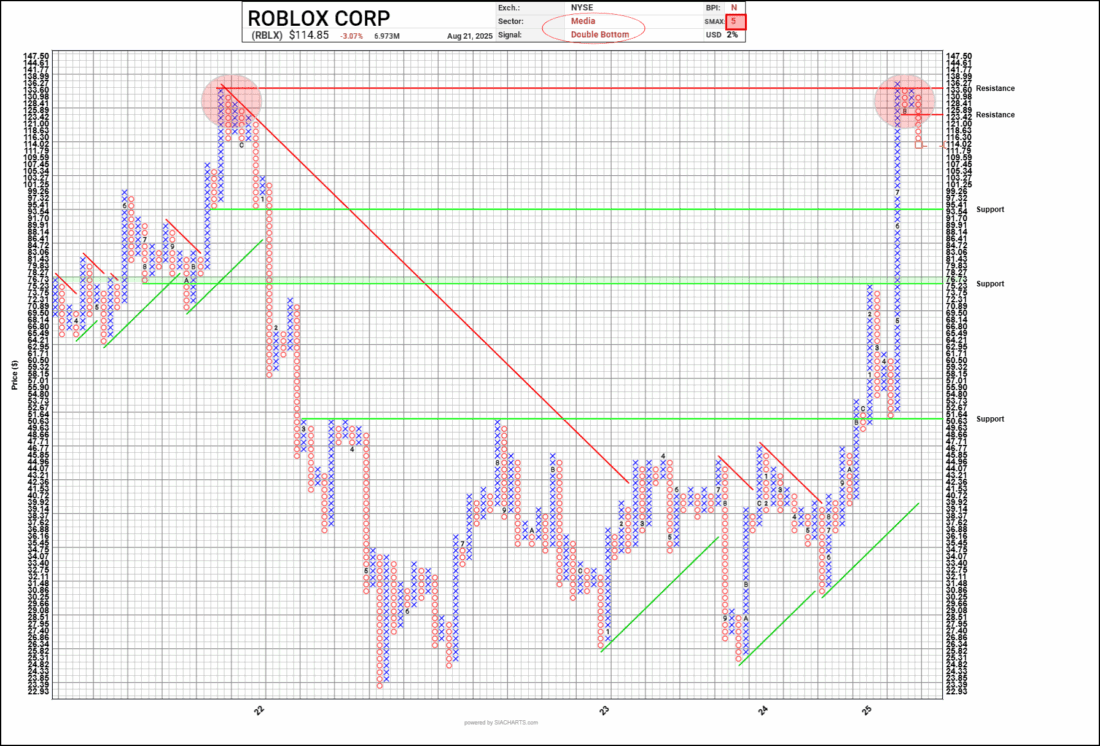
3/ Point and Figure Chart
Investopedia is partnering with CMT Association on this newsletter. The contents of this newsletter are for informational and educational purposes only, however, and do not constitute investing advice. The guest authors, which may sell research to investors, and may trade or hold positions in securities mentioned herein do not represent the views of CMT Association or Investopedia. Please consult a financial advisor for investment recommendations and services.
Roblox Corp. (RBLX)
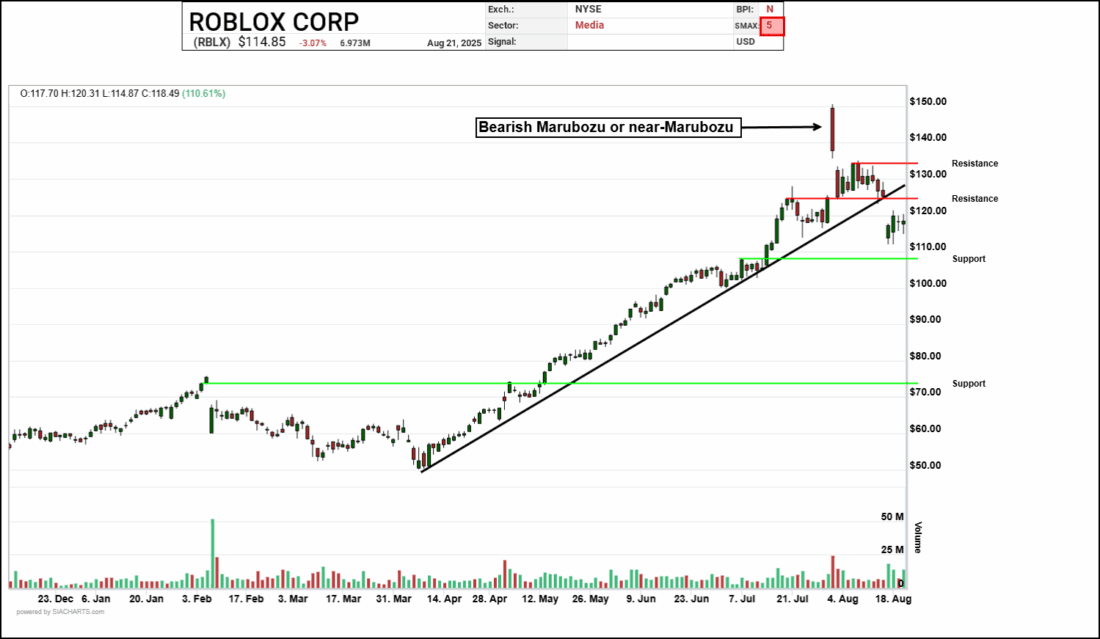
Roblox (RBLX) rallied into mid-2025 following strong Q2 results, which included a 51% year-over-year increase in bookings ($1.44B) and 41% growth in daily active users (111.8M). The stock reached record highs near $150 before retracing over 15% beginning in late July, amid growing legal and reputational concerns.
The shift in momentum coincided with the banning of a creator (YouTuber “Schlep”) known for exposing predators on the platform. Roblox’s legal actions against him drew media attention, which intensified when journalist Chris Hansen announced a documentary investigating Roblox’s moderation practices and child safety policies. Hansen is collaborating with Schlep and law enforcement officials.
Soon after, the Louisiana Attorney General filed a lawsuit against Roblox, alleging failures in protecting minors. These events contributed to increased public scrutiny and political interest. The stock has experienced heightened volatility, with sharp daily declines and a breakdown below intermediate trend lines (see black line), indicating a shift in price structure. Media coverage and potential regulatory developments remain ongoing factors.
Candlestick Chart
The candlestick marked by the arrow is a bearish Marubozu or near-Marubozu, defined by a tall red body with minimal upper and lower wicks. Derived from the Japanese word for “close-cropped,” a Marubozu shows no significant price movement beyond the open and close. This specific formation occurs when the price opens near the session high and closes near the low, reflecting sustained selling pressure throughout the period. On this chart, it follows a sharp upward move toward $150 and is positioned near the break of a long-standing uptrend, aligning with the broader shift in technical structure.
Point and Figure Chart
The point and figure chart illustrates the run-up in RBLX stock, having pushed past resistance at $50 per share in late 2024 and early 2025. Shares rallied up to around $75 and then pulled back to support at $50 during the market turmoil in spring 2025. Shares subsequently began their push toward $150 in the following quarter; a level last attained in late 2021. This resistance is marked with the upper red line and circle. Given the intensifying challenges mentioned earlier, this level may now be a key area of focus for shareholders, while $136.27 will be a level to monitor for any potential move through that price, which could suggest a continuation of upward momentum.
Given the latest double bottom on the chart and the move into a column of O’s, the first level of resistance for point and figure chartists may be the 3-box reversal level at $125.89, which is also the double bottom breakdown level. Support, on the other hand, lies considerably below current prices, reflecting the explosive move in share price earlier this year. Notable levels include $93.54 and $76.73, based on prior trading activity from 2021–2022. Also worth noting is the $50.63 level, which marks the breakout from early this year and could be considered an area of possible support.
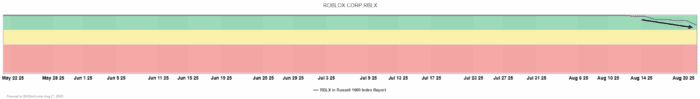
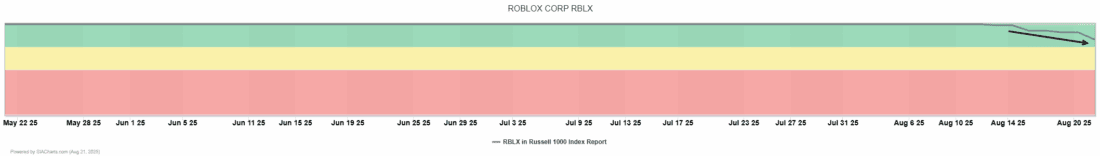
Taken together, the resistance levels mentioned above and the support levels sitting far below current prices may point to less favorable risk/reward parameters for SIA practitioners. One remaining technical positive is the stock’s continued inclusion in the favored zone of SIA Russell 1000 Index Report, although RBLX has fallen sharply in ranking, now sitting at position #175 out of 1000 names, down 170 spots in the past month. The SMAX score has also declined to a current reading of 5 out of 10, potentially indicating weaker relative strength against a basket of five alternative asset classes.
—
Originally posted 15th August 2025
Investopedia.com: The comments, opinions and analyses expressed herein are for informational purposes only and should not be considered individual investment advice or recommendations to invest in any security or to adopt any investment strategy. While we believe the information provided herein is reliable, we do not warrant its accuracy or completeness. The views and strategies described on our content may not be suitable for all investors. Because market and economic conditions are subject to rapid change, all comments, opinions and analyses contained within our content are rendered as of the date of the posting and may change without notice. The material is not intended as a complete analysis of every material fact regarding any country, region, market, industry, investment or strategy. This information is intended for US residents only.
Information posted on IBKR Campus that is provided by third-parties does NOT constitute a recommendation that you should contract for the services of that third party. Third-party participants who contribute to IBKR Campus are independent of Interactive Brokers and Interactive Brokers does not make any representations or warranties concerning the services offered, their past or future performance, or the accuracy of the information provided by the third party. Past performance is no guarantee of future results.
This material is from Investopedia and is being posted with its permission. The views expressed in this material are solely those of the author and/or Investopedia and Interactive Brokers is not endorsing or recommending any investment or trading discussed in the material. This material is not and should not be construed as an offer to buy or sell any security. It should not be construed as research or investment advice or a recommendation to buy, sell or hold any security or commodity. This material does not and is not intended to take into account the particular financial conditions, investment objectives or requirements of individual customers. Before acting on this material, you should consider whether it is suitable for your particular circumstances and, as necessary, seek professional advice.
Related Articles
")


Join The Conversation
For specific platform feedback and suggestions, please submit it directly to our team using these instructions.
If you have an account-specific question or concern, please reach out to Client Services.
We encourage you to look through our FAQs before posting. Your question may already be covered!