
- Solve real problems with our hands-on interface
- Progress from basic puts and calls to advanced strategies
Interactive Options Course

Posted August 15, 2025 at 9:37 am
By Todd Stankiewicz CMT, CFP, ChFC
1/ Buckle Up: Why August to October Can Be the Market’s Bumpy Season
2/ Sector Rotation Signals from RRGs
3/ Small Caps and Deregulation: A Forgotten Corner with Fresh Potential
Investopedia is partnering with CMT Association on this newsletter. The contents of this newsletter are for informational and educational purposes only, however, and do not constitute investing advice. The guest authors, which may sell research to investors, and may trade or hold positions in securities mentioned herein do not represent the views of CMT Association or Investopedia. Please consult a financial advisor for investment recommendations and services.
Buckle Up: Why August to October Can Be the Market’s Bumpy Season
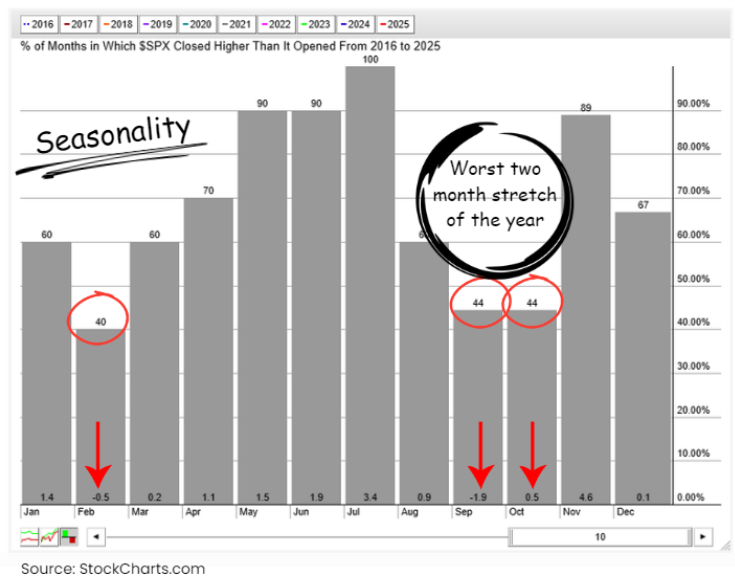
Seasonality is one of the quieter tools in a technician’s kit, but it can be surprisingly powerful. Strip away the headlines and macro debates, and a pattern remains: certain times of the year simply perform better than others. You don’t have to know exactly why for it to be useful…sometimes, “it is what it is” is enough.
Looking at the S&P 500’s seasonal trends over the last decade, one stretch stands out: August through October. September is historically the single worst month for average returns, February comes in second, and October takes a close third. August doesn’t always rank as poorly on average, but the back half often sets the tone for a volatile fall.
The Data Behind the Pattern
Over the last 10 years:
This isn’t to say the market always falls, just that the odds of choppier price action go up. Volatility tends to increase, trends can stall, and even healthy markets may retrace.
What It Means Now
We’re entering a part of the calendar where historical odds favor caution. That doesn’t mean “sell everything,” it means ensuring your portfolio can handle turbulence without forcing reactive decisions.
Consider:
The Takeaway
Seasonality won’t predict the future with certainty, but it’s valuable context. The August–October window has earned its reputation as a challenging stretch. Use this time to review allocations, check your risk controls, and stay patient. In markets, sometimes the smartest move is to prepare for the storm before you see the clouds.
S&P 500: Riding the Upper Band, But for How Long?
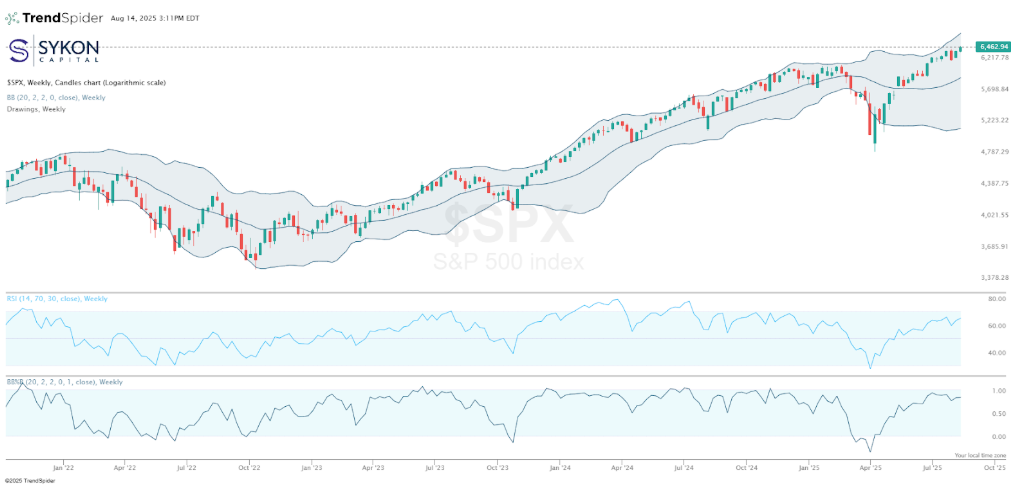
If we’re going to address the elephant in the room, let’s talk about the S&P 500. The weekly chart, with Bollinger Bands, RSI, and candlestick patterns, is showing a clear picture: strong momentum, stretched conditions, and signs we’re in a late-stage move.
Bollinger Bands: Extended Strength
On the weekly $SPX chart with Bollinger Bands (20,2,2):
When price rides the upper band for this long, the first logical pullback target is the middle band, now around 6200.
Momentum Signals
Candlestick Context
Path of Least Resistance
As long as:
…the trend remains upward. Still, narrowing ranges and lighter volume hint at distribution, meaning new long entries should be sized conservatively.
Bottom line
The S&P 500 remains in an extended uptrend, but it’s stretched. Watch for a rejection at the upper band as a potential first step toward a move back to the 6200 area. Until then, respect the momentum, but keep risk controls tight.
Small Caps and Deregulation: A Forgotten Corner with Fresh Potential
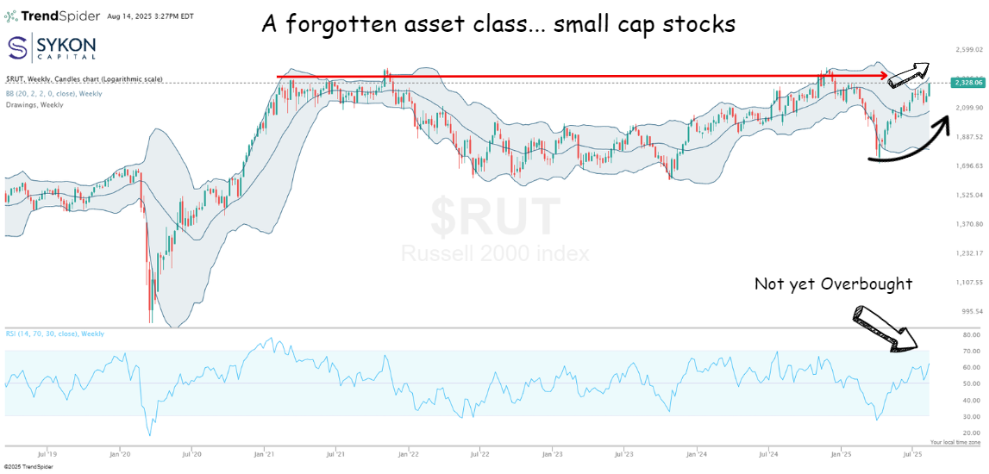
While headlines obsess over mega-cap tech, there’s a quieter story developing in small caps, one that could get louder if deregulation gains traction.
Industrials, healthcare, infrastructure, and communications services are among the sectors that could see real benefits from lighter regulatory burdens. And some small-cap companies are positioned to turn that policy shift into meaningful growth.
The Russell 2000, a benchmark for small-cap stocks, has lagged badly for years. But technically, it’s showing signs that a trend change may be underway.
The Technical Picture
On the weekly Russell 2000 chart:
Key Levels to Watch
Support:
Resistance:
A close above 2,400–2,450 would mark a significant technical breakout.
Why Deregulation Could Be the Catalyst
Small caps often outperform when:
Layer in sector-specific deregulation, and the impact could be amplified:
Bottom Line
Small caps have been in the shadows for years, but the combination of improving technicals and potential deregulation sets the stage for a shift.
The Russell 2000 still needs to clear 2,400 to confirm the breakout, but if policy winds align with price action, the next leg up in small caps could be led by the very sectors most primed to benefit from a lighter regulatory touch.
—
Originally posted 15th August 2025
Investopedia.com: The comments, opinions and analyses expressed herein are for informational purposes only and should not be considered individual investment advice or recommendations to invest in any security or to adopt any investment strategy. While we believe the information provided herein is reliable, we do not warrant its accuracy or completeness. The views and strategies described on our content may not be suitable for all investors. Because market and economic conditions are subject to rapid change, all comments, opinions and analyses contained within our content are rendered as of the date of the posting and may change without notice. The material is not intended as a complete analysis of every material fact regarding any country, region, market, industry, investment or strategy. This information is intended for US residents only.
Information posted on IBKR Campus that is provided by third-parties does NOT constitute a recommendation that you should contract for the services of that third party. Third-party participants who contribute to IBKR Campus are independent of Interactive Brokers and Interactive Brokers does not make any representations or warranties concerning the services offered, their past or future performance, or the accuracy of the information provided by the third party. Past performance is no guarantee of future results.
This material is from Investopedia and is being posted with its permission. The views expressed in this material are solely those of the author and/or Investopedia and Interactive Brokers is not endorsing or recommending any investment or trading discussed in the material. This material is not and should not be construed as an offer to buy or sell any security. It should not be construed as research or investment advice or a recommendation to buy, sell or hold any security or commodity. This material does not and is not intended to take into account the particular financial conditions, investment objectives or requirements of individual customers. Before acting on this material, you should consider whether it is suitable for your particular circumstances and, as necessary, seek professional advice.
Related Articles


")

Join The Conversation
For specific platform feedback and suggestions, please submit it directly to our team using these instructions.
If you have an account-specific question or concern, please reach out to Client Services.
We encourage you to look through our FAQs before posting. Your question may already be covered!