
- Solve real problems with our hands-on interface
- Progress from basic puts and calls to advanced strategies
Interactive Options Course
Posted February 13, 2025 at 9:20 am
From SIA Charts
1/ Johnson & Johnson (JNJ)
2/ SIA Drugs Equal Weight Index
3/ Point and Figure Chart
Investopedia is partnering with CMT Association on this newsletter. The contents of this newsletter are for informational and educational purposes only, however, and do not constitute investing advice. The guest authors, which may sell research to investors, and may trade or hold positions in securities mentioned herein do not represent the views of CMT Association or Investopedia. Please consult a financial advisor for investment recommendations and services.
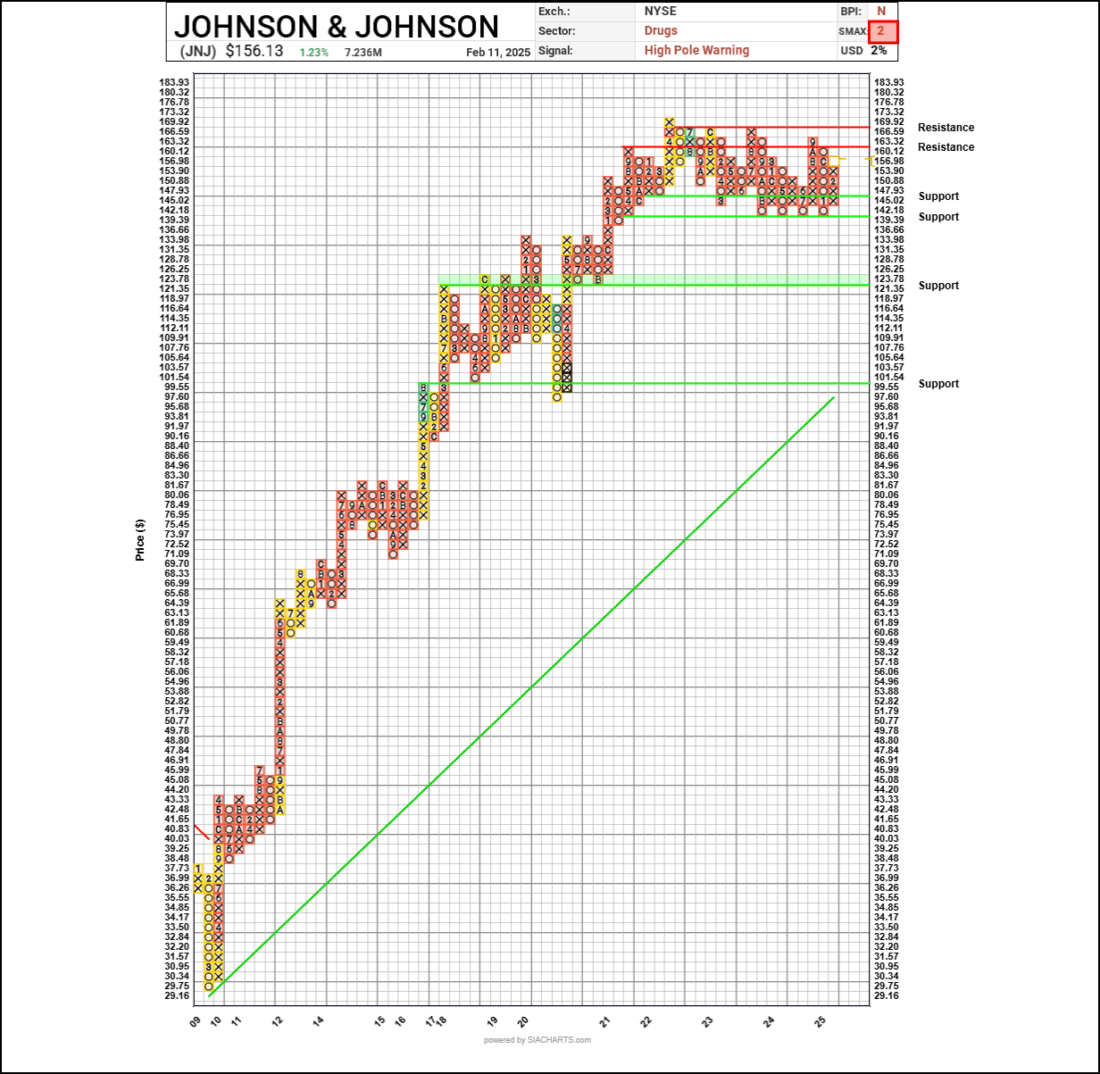
Johnson & Johnson (JNJ)

Courtesy of SIA Charts
Today, we will look at the weakest sector in the SIA Sector Report, which is the SIA Drugs Equal Weight Index (EWI436), and dig into its components where we find the name Johnson & Johnson (JNJ), which may be in a technically vulnerable position. First off, it’s not that Johnson & Johnson has been a market leader, as can be seen in the attached SIA matrix position chart above, where we can see that JNJ has maintained a low rank in the associated SIA S&P 100 Index Report for many years. This is not to say that the stock hasn’t moved higher, but on a relative basis, it has underperformed the other names within the matrix reports and against its direct peers within the Drug sector itself. But the conditions may have become even riskier now that the Drug sector is showing such low relative strength on its own.
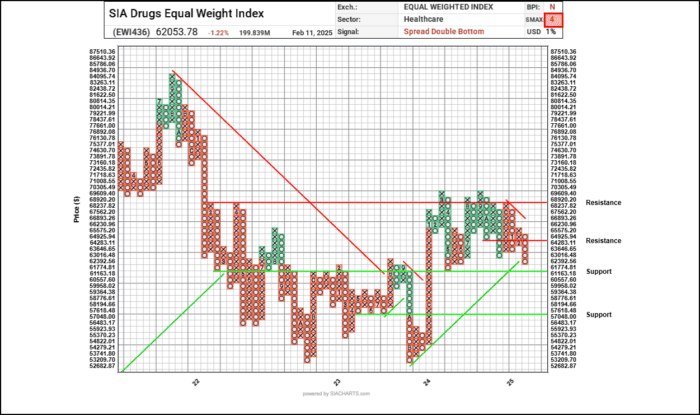
SIA Drugs Equal Weight Index
To highlight this lack of relative strength, we have attached a point and figure (pnf) chart of the SIA Drugs Equal Weight Index, where we have added the SMAX overlay tool to illustrate that once again the sector is underperforming the alternative asset classes like cash, bonds, commodities, currencies, and other market equity indexes. This sector chart is also now in the process of breaking through the positive trend line as it completes several PNF double bottom chart signals. Support is not far below current levels, which have been plotted on the chart with green lines, while the resistance is both at the 3-box reversal level as well as the top line, dating back beyond 2022.

Courtesy of SIA Charts
Point and Figure Chart
Turning to the next chart, we have established support and resistance on the PNF chart of JNJ, where the shares have been moving sideways for the better part of 5 years. During this time, they have grown by only +3.36%, creating a massive opportunity loss for investors in the company. Fortunately, support is tight, so any slip in the share price will complete a quadruple bottom sell signal on the PNF chart at $139.39, which will be a number to watch to the downside. Meanwhile, shares of JNJ have near-term support at the 3-box reversal level of $145.02, while resistance is at both the $163.32 and $169.92 levels. Should trading move below the $139.39 level, further support is highlighted on the PNF chart at $121.36 and all the way down at the trend line at $99.55, also consistent with the whole number psychological level of $100. Here, the SIA SMAX score is also negative with only 2 of the potential 10 vectors of strength visible. So, to sum up: JNJ shares are relative underperformers within a sector that is at the dead bottom of the SIA Sector matrix, has a negative SMAX score, and may be vulnerable to a quadruple bottom, with resistance tight above and support well below current levels, should the quadruple PNF signal complete to the downside. The one positive that JNJ shares have is that they are part of the US equity market, which is still the #1 asset class. But should that reading lose steam, JNJ shares could potentially be a low RS name in the lowest RS sector.
Courtesy of SIA Charts
—
Originally posted 13th February 2025
Investopedia.com: The comments, opinions and analyses expressed herein are for informational purposes only and should not be considered individual investment advice or recommendations to invest in any security or to adopt any investment strategy. While we believe the information provided herein is reliable, we do not warrant its accuracy or completeness. The views and strategies described on our content may not be suitable for all investors. Because market and economic conditions are subject to rapid change, all comments, opinions and analyses contained within our content are rendered as of the date of the posting and may change without notice. The material is not intended as a complete analysis of every material fact regarding any country, region, market, industry, investment or strategy. This information is intended for US residents only.
Information posted on IBKR Campus that is provided by third-parties does NOT constitute a recommendation that you should contract for the services of that third party. Third-party participants who contribute to IBKR Campus are independent of Interactive Brokers and Interactive Brokers does not make any representations or warranties concerning the services offered, their past or future performance, or the accuracy of the information provided by the third party. Past performance is no guarantee of future results.
This material is from Investopedia and is being posted with its permission. The views expressed in this material are solely those of the author and/or Investopedia and Interactive Brokers is not endorsing or recommending any investment or trading discussed in the material. This material is not and should not be construed as an offer to buy or sell any security. It should not be construed as research or investment advice or a recommendation to buy, sell or hold any security or commodity. This material does not and is not intended to take into account the particular financial conditions, investment objectives or requirements of individual customers. Before acting on this material, you should consider whether it is suitable for your particular circumstances and, as necessary, seek professional advice.
Related Articles

 for Daily Seasonal Data")


Join The Conversation
For specific platform feedback and suggestions, please submit it directly to our team using these instructions.
If you have an account-specific question or concern, please reach out to Client Services.
We encourage you to look through our FAQs before posting. Your question may already be covered!