
- Solve real problems with our hands-on interface
- Progress from basic puts and calls to advanced strategies
Interactive Options Course
Posted December 12, 2024 at 9:23 am
From SIA Charts
1/ Newell Brands Inc. (NWL)
2/ Index Report
3/ Point and Figure Chart
Investopedia is partnering with CMT Association on this newsletter. The contents of this newsletter are for informational and educational purposes only, however, and do not constitute investing advice. The guest authors, which may sell research to investors, and may trade or hold positions in securities mentioned herein do not represent the views of CMT Association or Investopedia. Please consult a financial advisor for investment recommendations and services.
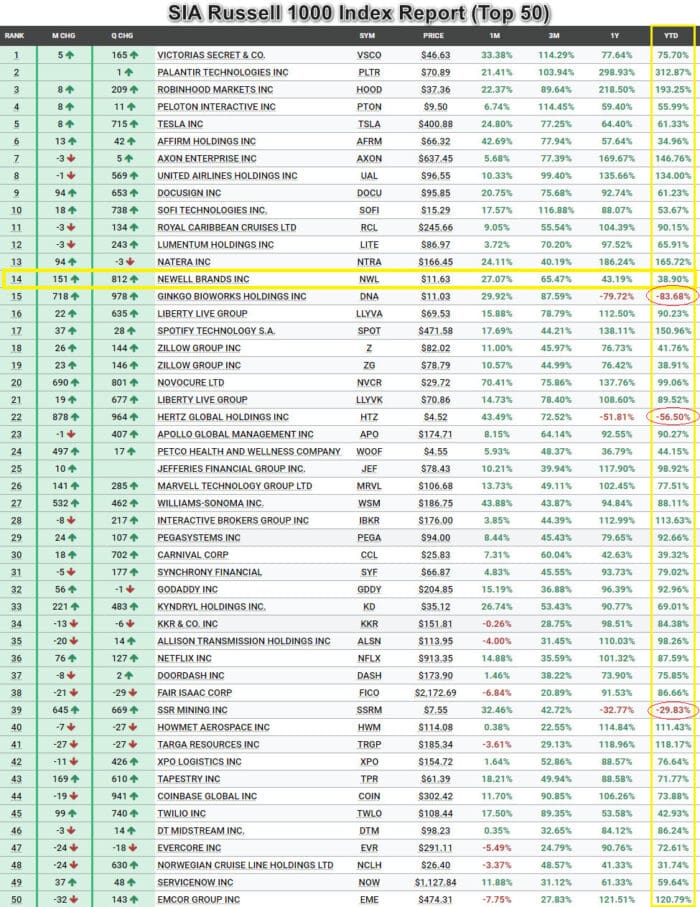
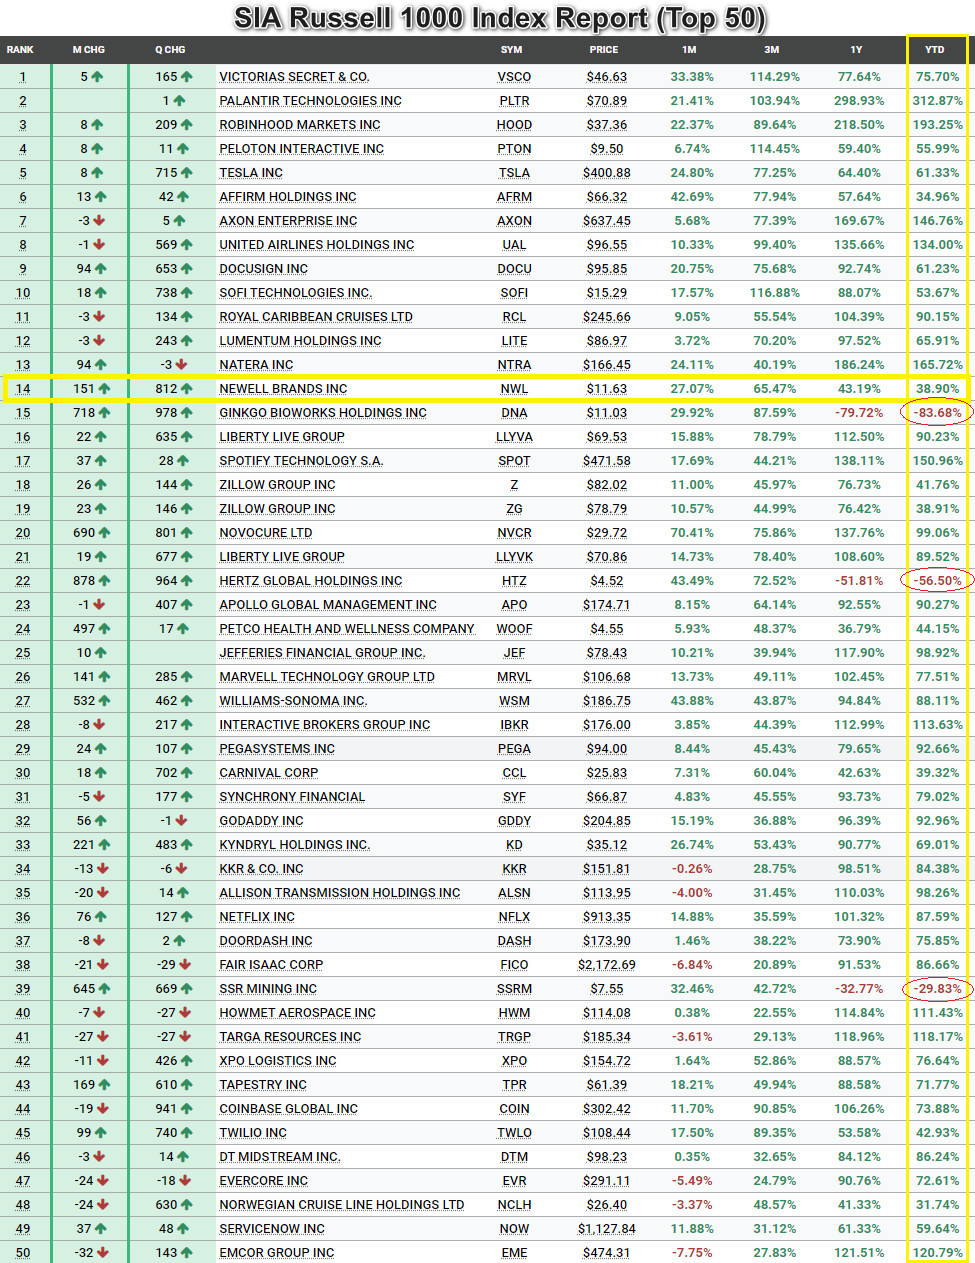
Newell Brands Inc. (NWL)
Courtesy of SIA Charts
Newell Brands Inc. (NWL), a company with a market capitalization of $4.81 billion, is an American manufacturer, marketer, and distributor of consumer and commercial products. Its stock has shown strong positive performance in the past quarter, rallying by 65.47%. During this time, shares of NWL have steadily moved up in the SIA Russell 1000 Index report, of which it is a constituent. The first chart attached clearly illustrates this movement, which contrasts sharply with the past several years, when it was positioned in the Unfavored (red) zone of the report. Currently, it has reached position #14, representing an impressive 151-place jump in the past month and 812 places in the past quarter. Year-to-date, shares of NWL have produced a return of 38.90%, following a significant period of underperformance earlier in the year.
Index Report
The significance of this rally is further highlighted in the attached table, which presents the top 50 positions in the SIA Russell 1000 Index Report. Here, the YTD return numbers have been emphasized, with many companies showing impressive returns exceeding 75%. However, a few names, marked in red, still show negative YTD returns, indicating that some are still catching up to the impressive performance of others. Newell Brands, with its 38.90% YTD return, remains one of the lowest performers among the top 50, likely due to its relatively recent rise.
Courtesy of SIA Charts
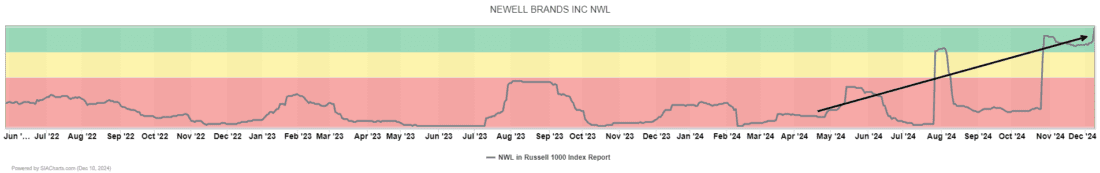
Point and Figure Chart
The third attachment, a 2% point-and-figure chart, offers a better understanding of the stock’s positioning and the significance of the latest rally. This chart clearly shows the large pullback in NWL’s price over the past four years, which is further emphasized with the SIA report overlay tool. The tool reveals that NWL had been in the Unfavored (red) zone, as indicated by the red oval. This has now changed, with the stock moving into the Favored (green) zone and breaking through resistance (now support) at $8.58. Having risen to the current level of $11.63, NWL is approaching the next levels of resistance at $12.01 and $12.75. Beyond these, the upper resistance level stands at $15.54. Support for the stock is now at $10.67, which corresponds with the 3-box reversal on the point-and-figure chart and a support zone that emerged in 2023. Additional support levels are found at $9.29 and again at the breakout point at $8.58, marked in green on the chart. Newell Brands boasts a perfect SMAX score of 10 out of 10, a technical indicator of near-term strength relative to other asset classes.

Courtesy of SIA Charts
—
Originally posted 12th December 2024
Investopedia.com: The comments, opinions and analyses expressed herein are for informational purposes only and should not be considered individual investment advice or recommendations to invest in any security or to adopt any investment strategy. While we believe the information provided herein is reliable, we do not warrant its accuracy or completeness. The views and strategies described on our content may not be suitable for all investors. Because market and economic conditions are subject to rapid change, all comments, opinions and analyses contained within our content are rendered as of the date of the posting and may change without notice. The material is not intended as a complete analysis of every material fact regarding any country, region, market, industry, investment or strategy. This information is intended for US residents only.
Information posted on IBKR Campus that is provided by third-parties does NOT constitute a recommendation that you should contract for the services of that third party. Third-party participants who contribute to IBKR Campus are independent of Interactive Brokers and Interactive Brokers does not make any representations or warranties concerning the services offered, their past or future performance, or the accuracy of the information provided by the third party. Past performance is no guarantee of future results.
This material is from Investopedia and is being posted with its permission. The views expressed in this material are solely those of the author and/or Investopedia and Interactive Brokers is not endorsing or recommending any investment or trading discussed in the material. This material is not and should not be construed as an offer to buy or sell any security. It should not be construed as research or investment advice or a recommendation to buy, sell or hold any security or commodity. This material does not and is not intended to take into account the particular financial conditions, investment objectives or requirements of individual customers. Before acting on this material, you should consider whether it is suitable for your particular circumstances and, as necessary, seek professional advice.
Related Articles


?")


Join The Conversation
For specific platform feedback and suggestions, please submit it directly to our team using these instructions.
If you have an account-specific question or concern, please reach out to Client Services.
We encourage you to look through our FAQs before posting. Your question may already be covered!