
- Solve real problems with our hands-on interface
- Progress from basic puts and calls to advanced strategies
Interactive Options Course
Posted July 17, 2024 at 8:40 am
From SIA Charts
1/ Visa Inc. (V)
2/ Candlestick Chart
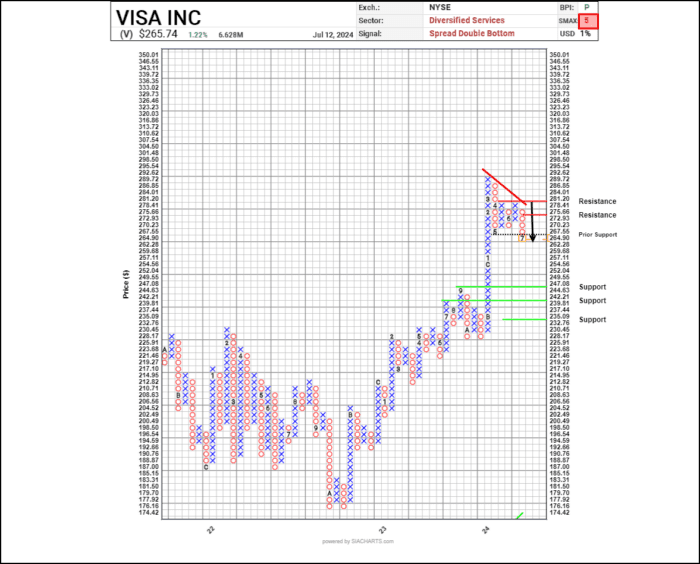
3/ Point and Figure Chart
Investopedia is partnering with CMT Association on this newsletter. The contents of this newsletter are for informational and educational purposes only, however, and do not constitute investing advice. The guest authors, which may sell research to investors, and may trade or hold positions in securities mentioned herein do not represent the views of CMT Association or Investopedia. Please consult a financial advisor for investment recommendations and services.

Courtesy of SIA Charts
SIA Charts’ relative strength rankings help investors manage risk by identifying stocks and sectors which are underperforming or starting to underperform relative to their peers and/or their benchmarks indicating that capital is moving elsewhere.
The five-year relative strength chart shows that credit card company Visa Inc. (V) has not been able to stay in the green zone of the SIA S&P 100 Index Report for more than a few days since September of 2020, making it a long-term relative strength underperformer.
It’s last attempt to climb up the rankings peaked back in November and since then, Visa has been steadily drifting downward. In the last month, the shares have dropped 9 positions to 57th place, returning to the Red Unfavored Zone for the first time since January of 2023. Over the last three months, Visa is down 3.5% while the S&P 100 Index is up 12.0%. An uptrend in Visa (V) shares which had started in the fall 2022 market bottom appears to have peaked back in March when a rally up toward $290.00 failed with a bearish Shooting Star candlestick, marking the peak. Since then, the shares have been in steady retreat, establishing a new downtrend of lower highs.
Candlestick Chart
Two weeks ago, V broke down below $265.00, completing a bearish Descending Triangle pattern, on a spike in volume, indicating an increase in selling pressure. The start of a new downtrend would be confirmed by a close below $260.00 which would snap the last remaining support line of the longer-term uptrend.
Potential downside support may emerge near the $250.00 round number, followed by $240.00 based on a measured move from the triangle, and then previous support near $230.00. Initial rebound resistance appears near $273.00 based on a retest of the 10-week moving average.

Courtesy of SIA Charts
A rally in Visa (V) shares peaked back in March and since then, they have come under distribution. Following an initial pullback, the shares settled into a lower range through the spring. This month, selling pressure has intensified and Visa has embarked on a new downleg, completing bearish Double Bottom and Spread Double Bottom breakdowns.
Point and Figure Chart
Next potential support appears near $244.60 where a vertical count converges with a retest of a previous breakout point. Horizontal counts suggest potential support near $239.60 and $232.75. Initial resistance on a rebound appears near $275.65 based on a 3-box reversal.
With a Bearish SMAX score (which is a near-term 1 to 90-day indicator comparing an asset against different equal-weight asset classes) of 5 out of 10, V is exhibiting short-term weakness against the asset classes.

Courtesy of SIA Charts
—-
Originally posted 17th July 2024
Investopedia.com: The comments, opinions and analyses expressed herein are for informational purposes only and should not be considered individual investment advice or recommendations to invest in any security or to adopt any investment strategy. While we believe the information provided herein is reliable, we do not warrant its accuracy or completeness. The views and strategies described on our content may not be suitable for all investors. Because market and economic conditions are subject to rapid change, all comments, opinions and analyses contained within our content are rendered as of the date of the posting and may change without notice. The material is not intended as a complete analysis of every material fact regarding any country, region, market, industry, investment or strategy. This information is intended for US residents only.
Information posted on IBKR Campus that is provided by third-parties does NOT constitute a recommendation that you should contract for the services of that third party. Third-party participants who contribute to IBKR Campus are independent of Interactive Brokers and Interactive Brokers does not make any representations or warranties concerning the services offered, their past or future performance, or the accuracy of the information provided by the third party. Past performance is no guarantee of future results.
This material is from Investopedia and is being posted with its permission. The views expressed in this material are solely those of the author and/or Investopedia and Interactive Brokers is not endorsing or recommending any investment or trading discussed in the material. This material is not and should not be construed as an offer to buy or sell any security. It should not be construed as research or investment advice or a recommendation to buy, sell or hold any security or commodity. This material does not and is not intended to take into account the particular financial conditions, investment objectives or requirements of individual customers. Before acting on this material, you should consider whether it is suitable for your particular circumstances and, as necessary, seek professional advice.
Related Articles


Join The Conversation
For specific platform feedback and suggestions, please submit it directly to our team using these instructions.
If you have an account-specific question or concern, please reach out to Client Services.
We encourage you to look through our FAQs before posting. Your question may already be covered!