
- Solve real problems with our hands-on interface
- Progress from basic puts and calls to advanced strategies
Interactive Options Course

Posted March 5, 2024 at 10:07 am
Is gold a more profitable investment than equities over the long term? Our finding is that the value of gold has mostly held its own against the U.S. equity market since the S&P 500 time series began over 94 years ago (Figure 1). A well-defined picture of their performance through peaks and troughs is evident when the S&P 500 dollar value is repriced in gold, which is done by dividing the S&P 500 by the U.S. dollar price of one troy ounce of bullion (Figure 2).
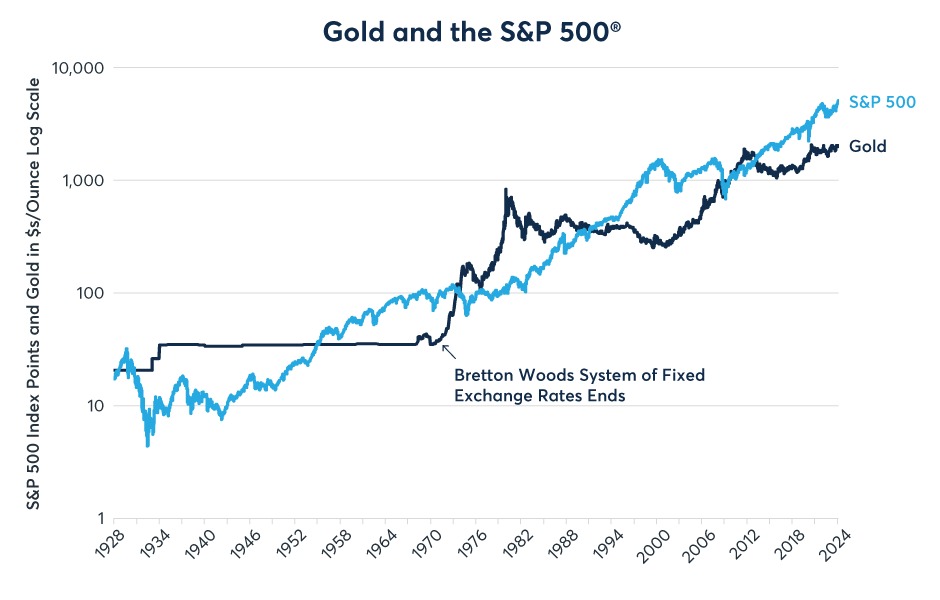
Source: Bloomberg Professional (GOLDS and SPX)
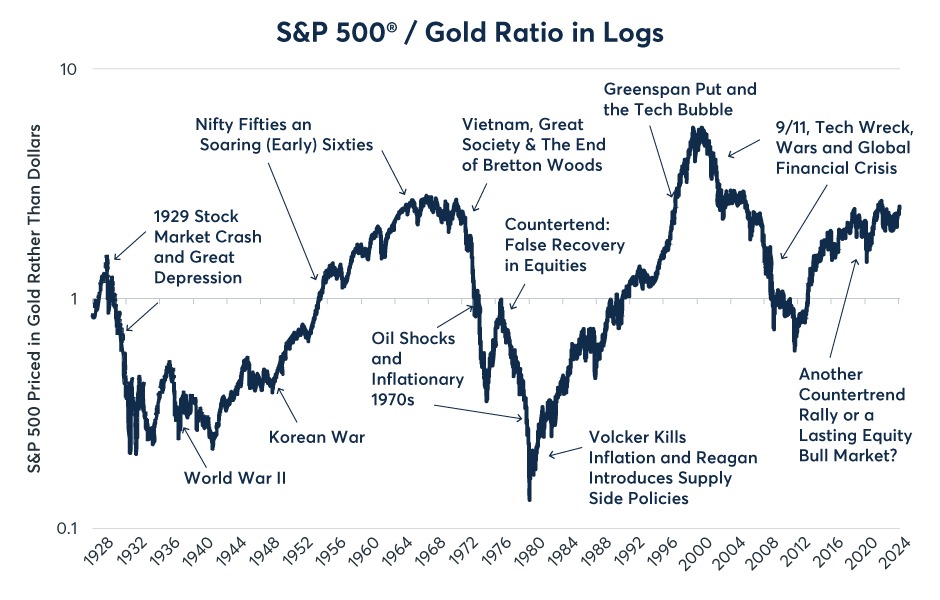
Source: Bloomberg Professional (GOLDS and SPX)
The S&P 500/gold ratio has been subject to extremely strong trends and occasional periods of consolidation which correspond with different economic and geopolitical situations, some of which benefitted equities relative to gold and vice versa. Generally, equities have done better than gold during periods of geopolitical stability, disinflation and steady economic growth, while gold tends to outperform during periods of instability. Switching from one circumstance to another can set off powerful trends in the S&P 500/gold ratio that can last for years, even decades. The same goes for Asian equity markets when compared to gold, although the price history isn’t as long and the patterns differ both in equity market performance and trends in the currency market.
Since the equity market’s peak on September 3, 1929, the S&P 500/gold ratio has been through six distinct eras:
What’s next? The S&P 500 fell 28% versus gold from late 2021 through 2022, and despite its 2023 rebound led by mega-cap companies dubbed the Magnificent Seven, it remains 5% lower versus gold as of late February 2024 despite being about 6% above its 2021 highs when expressed in dollar terms. A few points are clear:
These points have the potential to turn the tide against U.S. equities, which are highly valued (see our related article here), in favor of hard assets like gold. But what about much less expensive equity markets like those in China, Japan and Korea? South Korea’s KOSPI Index, Japan’s Nikkei 225 and Hong Kong’s Hang Seng Index have their own strong trends versus gold.
KOSPI: South Korean equities rocketed 779% higher versus gold during the last four years of the 1980s before losing most of those gains between late 1989 and the depths of the Asian financial crisis in 1998. Korean stocks more than tripled in value versus gold in 1999 and 2000 during the late stages of the tech bubble before falling back during the Tech Wreck bear market. They recovered versus gold in the years leading up to the Global Financial Crisis. Since 2009, KOSPI hasn’t exhibited such strong trends versus gold. At the moment, KOSPI is trading near historic lows versus the yellow metal (Figure 3).
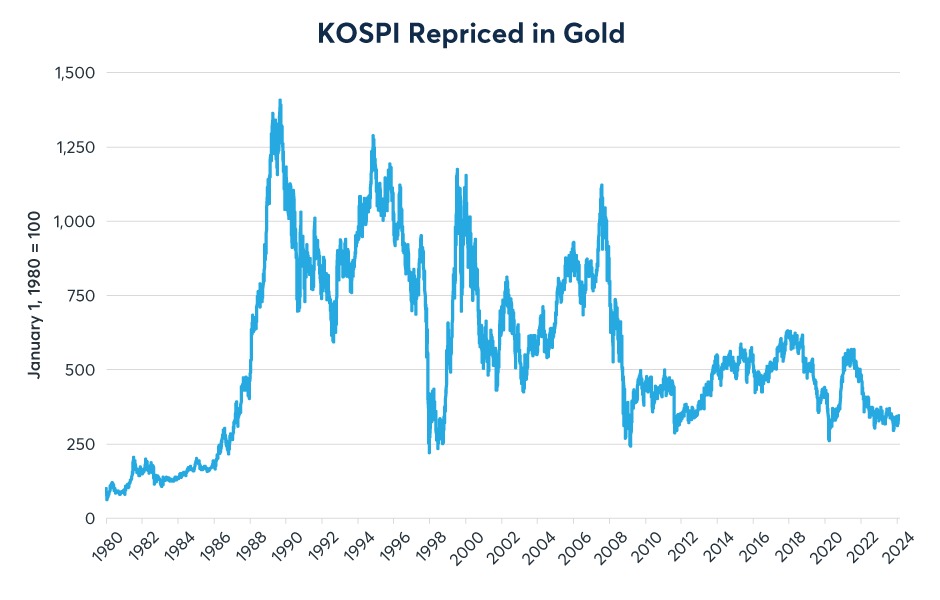
Source: Bloomberg Professional (Golds, KOSPI, KRW), CME Economic Research Calculations
Nikkei 225: Japan’s stocks rallied 1,300% versus gold during the 1980s and actually held their own versus gold during the 1990s. This may come as a surprise because Japanese stocks slumped 50% in yen (JPY) terms during the 1990s but JPY rose in value versus USD, which in turn rose versus gold. All told, the Japanese stock market peaked versus gold in 2000. Between 2000 and 2012, the Nikkei lost over 90% of its value in gold terms as gold soared versus the dollar and the Nikkei 225 fell another 50% in yen terms. Since 2012, Japanese stocks have rallied, surpassing their 1989 yen-denominated record high in 2024. However, gold has risen to over $2,000 per ounce and the dollar has nearly doubled in value versus the yen, negating the Japanese equity market’s progress when viewed in gold terms (Figure 4). Viewing gold versus the TOPIX, rather than the Nikkei, yields nearly identical results.
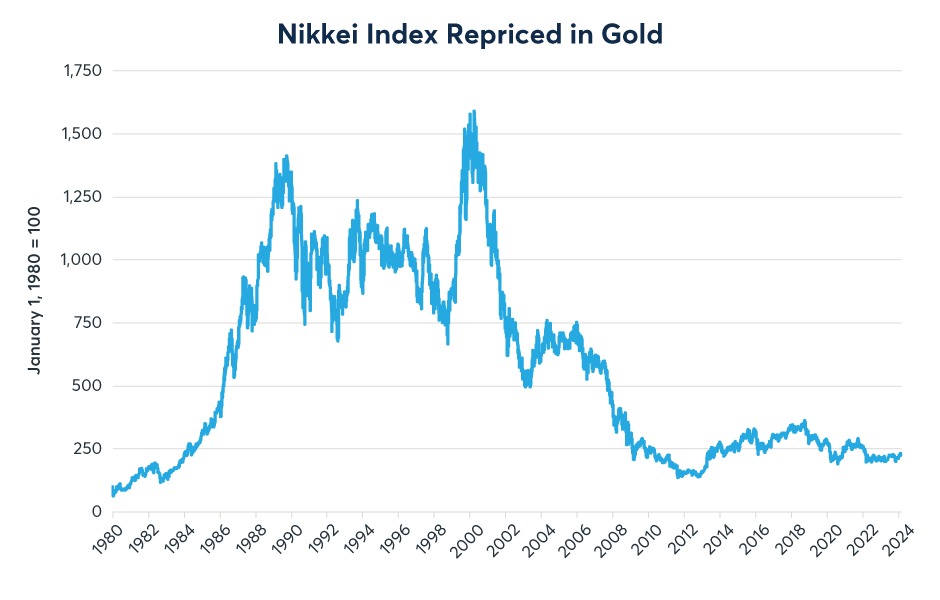
Source: Bloomberg Professional (Golds, NKY, JPY), CME Economic Research Calculations
Finally, Hong Kong’s Hang Seng Index rose by 2,250% versus gold from 1980s to 2000 as stocks soared and gold prices fell from $800 to $280 per ounce. Unlike in Korea or Japan, most of the outperformance came during the 1990s rather than during the 1980s. Since 2000, the Hang Seng has fallen by nearly 90% versus gold. From 2000-2011, its performance mirrored that of the S&P 500 but, unlike the S&P, the Hang Seng never recovered versus gold between 2011 and 2021 (Figure 5). This underperformance was probably due to the S&P’s abundance of technology shares, which have driven its outperformance versus nearly every major equity index outside of the U.S. over the past decade, along with Hong Kong’s specific challenges and the recent deceleration of the Chinese economy (read our related article here). The Hong Kong dollar hasn’t played much of a role, having been pegged to USD since 1983 after a 33% devaluation in the early 1980s.
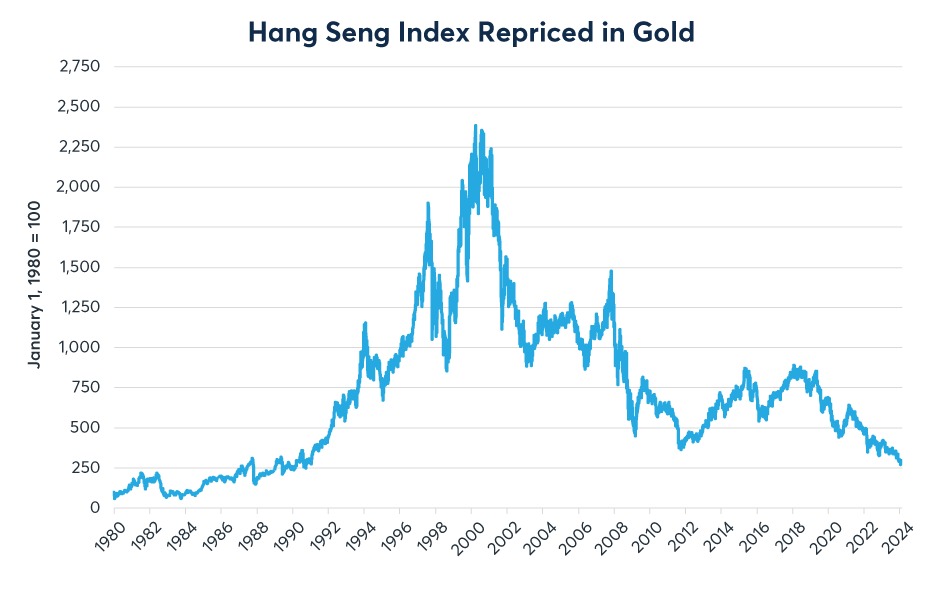
Source: Bloomberg Professional (Golds, HSI, HKD), CME Economic Research Calculations
—
Originally Posted February 29, 2024 – Gold’s Performance Against U.S., Asian Equities the Past Century
All examples in this report are hypothetical interpretations of situations and are used for explanation purposes only. The views in this report reflect solely those of the author and not necessarily those of CME Group or its affiliated institutions. This report and the information herein should not be considered investment advice or the results of actual market experience.
© [2023] CME Group Inc. All rights reserved. This information is reproduced by permission of CME Group Inc. and its affiliates under license. CME Group Inc. and its affiliates accept no liability or responsibility for the information contained herein, including but not limited to the currency, accuracy and/or completeness of this information, and delays, interruptions, errors or omissions. This information is an unofficial copy and may not reflect the official and accurate version. For the definitive and up-to-date version of any of this information, please see cmegroup.com.
Information posted on IBKR Campus that is provided by third-parties does NOT constitute a recommendation that you should contract for the services of that third party. Third-party participants who contribute to IBKR Campus are independent of Interactive Brokers and Interactive Brokers does not make any representations or warranties concerning the services offered, their past or future performance, or the accuracy of the information provided by the third party. Past performance is no guarantee of future results.
This material is from CME Group and is being posted with its permission. The views expressed in this material are solely those of the author and/or CME Group and Interactive Brokers is not endorsing or recommending any investment or trading discussed in the material. This material is not and should not be construed as an offer to buy or sell any security. It should not be construed as research or investment advice or a recommendation to buy, sell or hold any security or commodity. This material does not and is not intended to take into account the particular financial conditions, investment objectives or requirements of individual customers. Before acting on this material, you should consider whether it is suitable for your particular circumstances and, as necessary, seek professional advice.
Related Articles


Join The Conversation
For specific platform feedback and suggestions, please submit it directly to our team using these instructions.
If you have an account-specific question or concern, please reach out to Client Services.
We encourage you to look through our FAQs before posting. Your question may already be covered!