
- Solve real problems with our hands-on interface
- Progress from basic puts and calls to advanced strategies
Interactive Options Course
Lesson 3 of 5
Let’s start by discussing some of the core dividend metrics that are crucial when assessing whether a stock is a good candidate for dividend income.
As discussed in the previous lesson, the dividend yield is one of the first things investors look at when considering a dividend-paying stock.
A higher yield might seem attractive at first, but it’s important to evaluate whether the yield is sustainable. Extremely high yields can be a red flag, as they may signal financial distress or a company using dividends to prop up stock prices. Conversely, a reasonable and stable yield indicates a company is committed to returning value to shareholders through dividends.
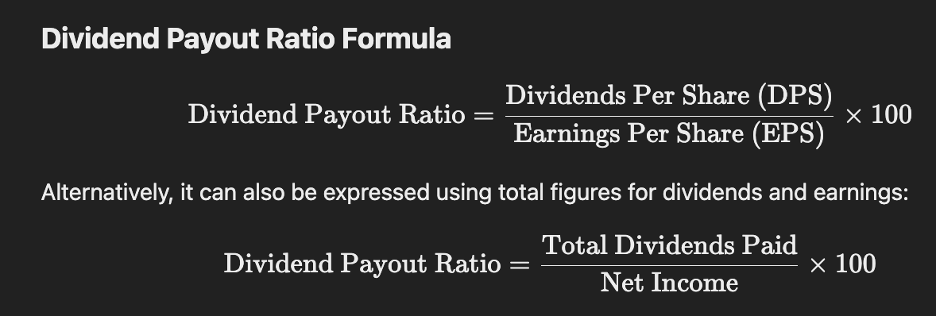
The dividend payout ratio measures how much of a company’s earnings are paid out as dividends. It is calculated by dividing the annual dividend per share by the earnings per share (EPS). If a company earns $10 per share and pays out $3 in dividends, its payout ratio is 30%.
This ratio is crucial because it indicates the balance between rewarding shareholders and reinvesting in the business. A high payout ratio might suggest that the company is paying out a large portion of its earnings, leaving less room for growth or to weather economic downturns. A low payout ratio, on the other hand, can signal that the company is conservatively managing its profits, potentially using the excess cash for expansion or debt reduction.
The dividend growth rate represents the rate at which a company’s dividends have grown over a specified period—usually over the past five or ten years. If a company consistently increases its dividend payout, this can signal financial strength and a commitment to returning capital to shareholders.
The simple formula to calculate the Dividend Growth Rate is:
Dividend in the Current Year minus Dividend in the Previous Year divided by Dividend in the Previous Year x 100.
For example, if a company paid a dividend of $2.00 in the current year and $1.80 in the previous year the Dividend Growth Rate is 11.11%.

Why would a company, that offers a dividend, have a zero-dividend growth rate?
A 0% dividend growth rate likely reflects the company’s focus on reinvesting profits for growth and maintaining financial flexibility, rather than committing to regular dividend increases. A company may prioritize capital reserves, technology upgrades, and market expansion over higher payouts. Additionally, the company might use stock buybacks as an alternative way to return value to shareholders and prefer not to raise dividends in order to avoid overextension or disrupting its cash flow. This conservative approach helps ensure the company has the liquidity needed for strategic investments and market adaptability.
Now that we’ve discussed a few dividend metrics, let’s turn our attention to broader financial indicators. These metrics provide insight into a company’s overall ability to generate profits and maintain its dividend policy.
Earnings per shareis a key metric that indicates how much profit a company generates per share of stock. It’s calculated by dividing the company’s net income by the number of outstanding shares. For instance, if a company has a net income of $5 million and 1 million shares outstanding, the EPS would be $5.


EPS provides an indication of a company’s profitability. A strong and growing EPS suggests that the company is generating sufficient profit to pay dividends, reinvest in the business, and finance future growth. Low or declining EPS can be a concern, as it may mean the company is struggling to generate profits, which can impact its ability to maintain or grow dividends.
Free cash flow (FCF) is the cash a company generates after spending money on capital expenditures (CapEx), such as purchasing equipment or facilities. It’s calculated by subtracting CapEx from operating cash flow. FCF is a critical indicator of financial health because it shows how much cash is available for paying dividends, repaying debt, or reinvesting in the business.
Free cash flow is crucial because it provides insight into a company’s ability to generate cash after maintaining its operations.
Finally, assessing a company’s debt levels and interest coverage ratio is vital for understanding its financial stability. The interest coverage ratio is calculated by dividing the company’s earnings before interest and taxes (EBIT) by its interest expenses. This ratio shows how easily the company can cover its interest payments on debt.


A high ratio means the company is generating significantly more income than what it needs to pay interest on its debt, suggesting a lower risk of default.
A low interest coverage ratio indicates potential difficulty in meeting debt obligations. By examining these fundamental metrics, you’ll be better equipped to choose stocks that can provide both reliable and growing dividend income over the long term.
The analysis in this material is provided for information only and is not and should not be construed as an offer to sell or the solicitation of an offer to buy any security. To the extent that this material discusses general market activity, industry or sector trends or other broad-based economic or political conditions, it should not be construed as research or investment advice. To the extent that it includes references to specific securities, commodities, currencies, or other instruments, those references do not constitute a recommendation by IBKR to buy, sell or hold such investments. This material does not and is not intended to take into account the particular financial conditions, investment objectives or requirements of individual customers. Before acting on this material, you should consider whether it is suitable for your particular circumstances and, as necessary, seek professional advice.
The views and opinions expressed herein are those of the author and do not necessarily reflect the views of Interactive Brokers, its affiliates, or its employees.


Join The Conversation
For specific platform feedback and suggestions, please submit it directly to our team using these instructions.
If you have an account-specific question or concern, please reach out to Client Services.
We encourage you to look through our FAQs before posting. Your question may already be covered!