
- Solve real problems with our hands-on interface
- Progress from basic puts and calls to advanced strategies
Interactive Options Course

Posted August 29, 2025 at 9:45 am
This week, we cover two ‘Expensive but Worth It’ large cap names, Workday, Inc. (WDAY, rated ‘Overweight’) and BYD Company Limited (1211 HK, rated ‘Overweight’).
The S&P 500 is up just shy of 10% YTD at the time of writing, with 46% of firms in the index having outperformed YTD. EVA Fundamentals for the index have seen ongoing improvements since the end of 2024. EVA Margin (profitability) is strong at 5.6%, which is still above the pre-Covid highs and 420bps above our global aggregate level. Given such strong market performance, we wanted to look at the analysis across the outperformers and underperformers YTD.
This week we look at our EVA Themes in the Asian markets and analyze the performance of the themes during prior periods where we have seen a weaker dollar. Two themes, Growth and Risky Profits at a Reasonable Price, generated the most alpha during periods of weakening USD.
Firms have started flagging increased procurement costs as they restock inventories at higher, post-tariff rates, a phenomenon we underlined in a paper last month. Firms with underlying pricing power strength and superior cost management abilities, reflected in favorable EBITDAR Margin trends, should remain more resilient through this period of elevated inflation levels.
The Electric Utilities industry in the U.S. has undergone a remarkable shift since 2020, being tied to the AI growth story and investment cycle as Big Tech ramped up investments into power-hungry hyperscalers. New investments are pouring into renewables and natural gas-fired power plants to keep up with the increased commercial and industrial demand for power. We see signs of firms scaling into this new investment, with aggregate top-line growth accelerating through 2025.
We identify attractive names in the Russell 2000 Index with strong EVA growth scores (Profitability Trend, P2), attractive PRVit, and strong ESG Performance Scores.
We identify attractive names in the Russell 2000 Index with cheap Value scores (V), attractive PRVit, and strong ESG Performance Scores. The PRVit framework compares a firm’s operational Quality to the Value paid in the market: the greater the disconnect between Quality and Value, the more favorable the stock.
On average, Large Cap firms look attractive in the PRVit model, demonstrating strong levels of Risk-Adjusted Profitability and cheap Valuations. EVA Fundamentals for the industry have, however, worsened through the year.
Quality has continued to trend down as cheap Value has trended up. PRVit is off slightly as the outperformance of Value was not sufficient to offset the decline in Quality. Cheap Value had stronger performance in the U.S. and the overall PRVit factor generated higher alpha than in the Global universe.
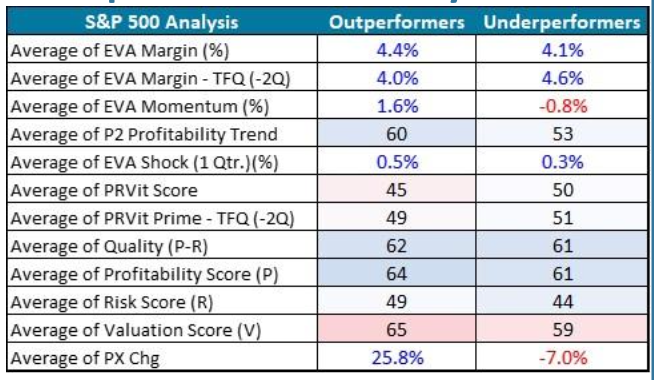
In our table of the week, we show the EVA data for the 231 outperformers (+10% YTD return) and the 277 underperformers. The EVA Margin on average is currently 30bps higher for the outperformers, at 4.4%. Compared to the beginning of the year, the outperformers have seen an improvement in Profitability, with a 40bps improvement in EVA Margin, positive EVA Momentum, a higher Profitability Trend score, and a higher recent trend in Profitability, as illustrated by EVA Shock 1Q. The PRVit score is lower, as higher Quality also has a higher Valuation attached for the outperforming
cohort. The average return for the outperformers is 25.8% versus -7% for the underperformers. For more insight see our S&P 500 EVA YTD Winners & Losers report.
Information posted on IBKR Campus that is provided by third-parties does NOT constitute a recommendation that you should contract for the services of that third party. Third-party participants who contribute to IBKR Campus are independent of Interactive Brokers and Interactive Brokers does not make any representations or warranties concerning the services offered, their past or future performance, or the accuracy of the information provided by the third party. Past performance is no guarantee of future results.
This material is from ISS EVA and is being posted with its permission. The views expressed in this material are solely those of the author and/or ISS EVA and Interactive Brokers is not endorsing or recommending any investment or trading discussed in the material. This material is not and should not be construed as an offer to buy or sell any security. It should not be construed as research or investment advice or a recommendation to buy, sell or hold any security or commodity. This material does not and is not intended to take into account the particular financial conditions, investment objectives or requirements of individual customers. Before acting on this material, you should consider whether it is suitable for your particular circumstances and, as necessary, seek professional advice.
Related Articles


Join The Conversation
For specific platform feedback and suggestions, please submit it directly to our team using these instructions.
If you have an account-specific question or concern, please reach out to Client Services.
We encourage you to look through our FAQs before posting. Your question may already be covered!