
- Solve real problems with our hands-on interface
- Progress from basic puts and calls to advanced strategies
Interactive Options Course
Posted November 16, 2023 at 10:40 am
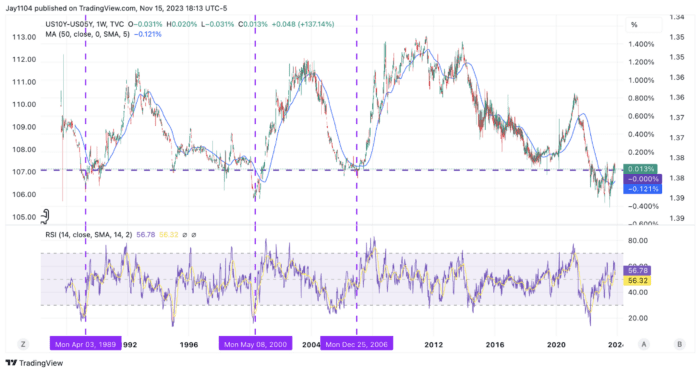
Stocks finished flat today, following the slightly stronger-than-expected retail sales and weaker PPI data. Overall, yields and the dollar rose, which helped hold the S&P 500 to a gain of only 16 bps. Additionally, we continue to see yield curve normalization as the 10-year rate moved higher than the 5-year rate and back into positive territory. This isn’t the first time this has happened but appears that the process of a normalized yield curve is happening.

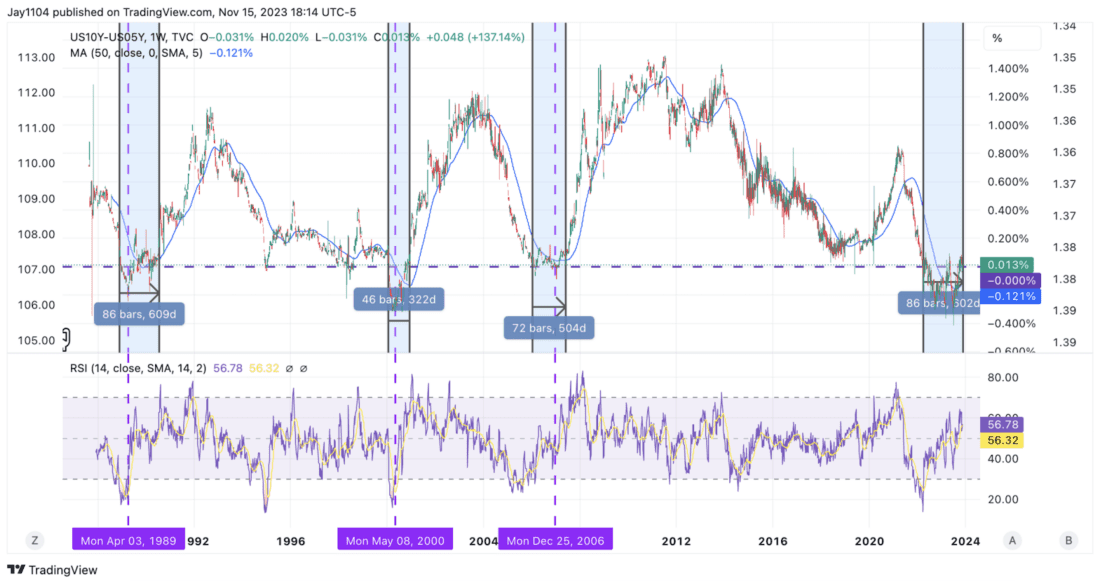
I think this process will continue, as the 2/10 inversion has already lasted longer than 2000 and within a month or so of surpassing the inversion before 2008 and within 100 days of the 1990 inversion. So, the days of the yield curve remaining inverted seem limited at this point based on historical standards.

Even the 10-5 inversion is getting old and has already far surpassed the inversions of 2000 and 2008. The inversion of 1990 seems to have lasted a few days longer than the current inversion.
The only thing that could spark a steepening at this point will be the jobs data and a rise in the unemployment rate. Tomorrow we will get the initial jobless claims, and we will want to pay close attention to how the yield curve responds to the data not just the direction of rates. Obviously, data that comes in higher than expected would move this steepening of the curve further along.
The S&P 500 hit some solid fib levels today, at the 78.6% retracement level from the July to October decline. It also reached the 61.8% extension of wave A. The structure from July to October is a clear five waves, and the structure off the October lows is a straightforward three waves. If the rally stops here, this marks the end of wave 2, and we will be entering wave 3, which would mean we would easily surpass the lows of October at 4,100 on the S&P 500. Of course, this could all be invalidated with the index reaching the July highs. But at this point, I don’t have a count for that.

I know my analysis doesn’t go with the seasonality charts plastered all over the internet. However, this comparison of the Nasdaq 100 of today with 2022 could just as easily be made to fit as all those seasonality charts. The point is to remain open to the possibility that markets don’t always go up, and just because it is the fourth quarter, it doesn’t mean we will have a solid finish to the year.

Another reason is that it is OPEX this Friday, and it is not unusual to see a trend change around the time of OPEX.
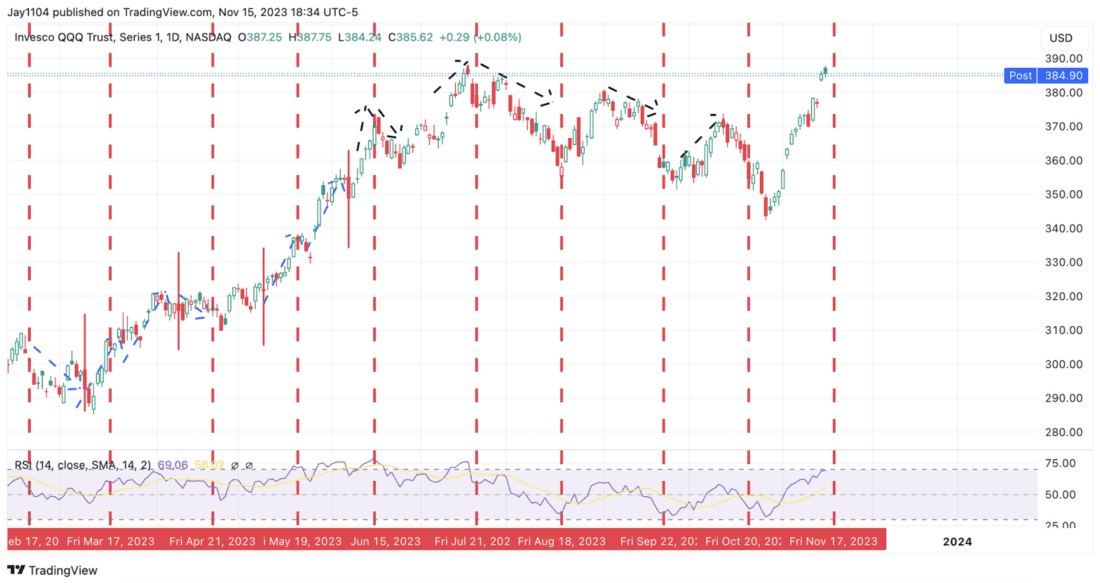
Finally, if the yield curve is steepening, the days of stock price movement are closer to the end than the beginning based on historical data.
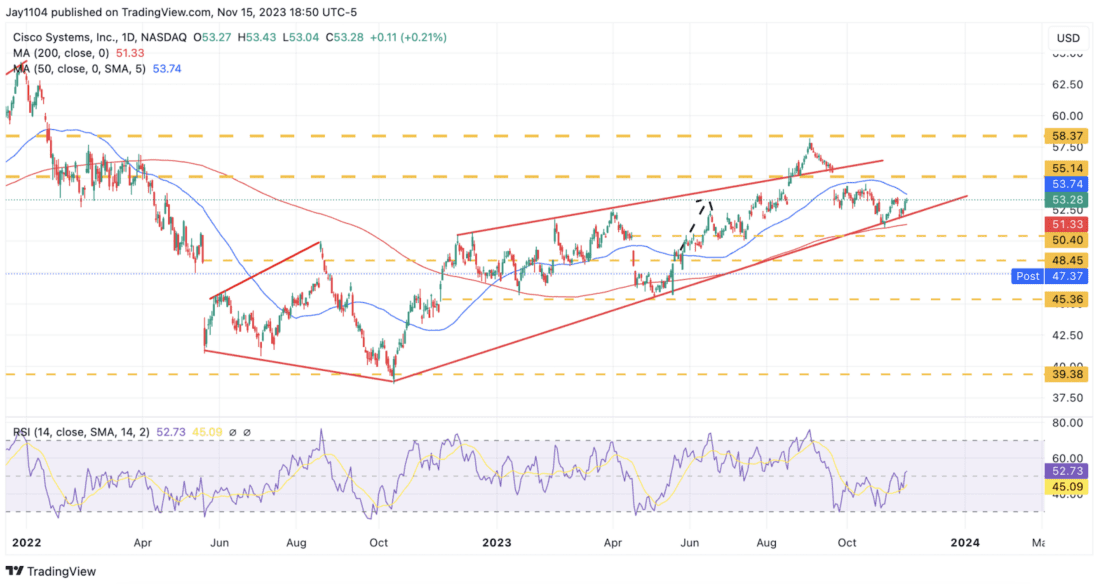
Cisco is trading down tonight by more than 10% after giving ugly guidance as companies cut back on spending. The company sees fiscal second-quarter revenue of $12.6 billion to $12.8 billion versus estimates of $14.2 billion. The stock in the after-hours has cut through multiple layers of support, and if it opens down as indicated, it probably needs to trade to around $45.30 to find its next strong level of support.
Meanwhile, Palo Alto was trading down around 6% after it provided fiscal second quarter bulling guidance of $2.34 billion to $2.39 billion versus estimates of $2.43B. The company also cut fiscal year billing guidance from $10.7 billion to $10.8 billion versus prior guidance of $10.9 billion to $11.0 billion. The company noted customers have been seeking deferred payment terms or discounts driven by a more cautious view of the economy and higher interest rates impacts on budgets.
The stock has been trending higher but has stalled out more recently, it also appears to have broken a significant uptrend in after-hours trading. If that uptrend’s break persists at tomorrow’s opening, the stock eventually moves lower to fill the gap to around $210.

—
Originally Posted November 15, 2023 – Stocks Stall As Yield Curve Normalization Process Takes Another Step Forward
Charts used with the permission of Bloomberg Finance L.P. This report contains independent commentary to be used for informational and educational purposes only. Michael Kramer is a member and investment adviser representative with Mott Capital Management. Mr. Kramer is not affiliated with this company and does not serve on the board of any related company that issued this stock. All opinions and analyses presented by Michael Kramer in this analysis or market report are solely Michael Kramer’s views. Readers should not treat any opinion, viewpoint, or prediction expressed by Michael Kramer as a specific solicitation or recommendation to buy or sell a particular security or follow a particular strategy. Michael Kramer’s analyses are based upon information and independent research that he considers reliable, but neither Michael Kramer nor Mott Capital Management guarantees its completeness or accuracy, and it should not be relied upon as such. Michael Kramer is not under any obligation to update or correct any information presented in his analyses. Mr. Kramer’s statements, guidance, and opinions are subject to change without notice. Past performance is not indicative of future results. Neither Michael Kramer nor Mott Capital Management guarantees any specific outcome or profit. You should be aware of the real risk of loss in following any strategy or investment commentary presented in this analysis. Strategies or investments discussed may fluctuate in price or value. Investments or strategies mentioned in this analysis may not be suitable for you. This material does not consider your particular investment objectives, financial situation, or needs and is not intended as a recommendation appropriate for you. You must make an independent decision regarding investments or strategies in this analysis. Upon request, the advisor will provide a list of all recommendations made during the past twelve months. Before acting on information in this analysis, you should consider whether it is suitable for your circumstances and strongly consider seeking advice from your own financial or investment adviser to determine the suitability of any investment.
Mott Capital Management is the portfolio manager for one portfolio offered by Interactive Advisors. Interactive Advisors clients do not invest directly with the Portfolio Managers like Mott Capital Management, and the Managers do not have discretionary trading authority over Interactive Advisors client accounts. The Portfolio Managers on the Interactive Advisors platform simply license their trade data to Interactive Advisors, which then allows its clients to have the same strategy and trading decisions mirrored in their accounts if the Portfolio is in line with their risk score. Portfolio Managers like Mott Capital Management implement their trading philosophy and strategy without knowing the identity of Interactive Advisors’ clients or taking into account these clients’ individualized circumstances.
Mott Capital Management has entered into a Portfolio Manager License Agreement with Interactive Advisors pursuant to which it provides trading data IA uses to offer a portfolio to its investment advisory clients. Mott Capital Management is not affiliated with any entities in the Interactive Brokers Group.
Interactive Advisors is an affiliate of Interactive Brokers LLC.
Pursuant to the Investment Management Agreement between Interactive Advisors and its clients, all brokerage transactions occur through Interactive Brokers LLC, an affiliate of Interactive Advisors. The use of an affiliate for brokerage services represents a potential conflict of interest as Interactive Brokers LLC is paid a commission on trades executed on behalf of Interactive Advisors. Interactive Brokers LLC does not consider this conflict material as it does not sell, solicit, recommend, trade against or otherwise attempt to induce Interactive Advisors to place any orders in any products. Interactive Advisors does not offer services through any other broker-dealer. All trading by Interactive Advisors is self-directed. Interactive Advisors clients acknowledge this potential conflict of interest and authorize Interactive Advisors to execute transactions through Interactive Brokers LLC when they open an Interactive Advisors account. Clients should consider the commissions and other expenses, execution, clearance, and settlement capabilities of Interactive Brokers LLC as a factor in their decision to invest in an Interactive Advisors Portfolio. Interactive Advisors believes it satisfies its best execution obligation by trading its clients’ trades through Interactive Brokers LLC. While there can be no assurance that it will in fact achieve best execution, Interactive Advisors does periodically monitor the execution quality of transactions to ensure that clients receive the best overall trade execution pursuant to regulatory requirements.
Information posted on IBKR Campus that is provided by third-parties does NOT constitute a recommendation that you should contract for the services of that third party. Third-party participants who contribute to IBKR Campus are independent of Interactive Brokers and Interactive Brokers does not make any representations or warranties concerning the services offered, their past or future performance, or the accuracy of the information provided by the third party. Past performance is no guarantee of future results.
This material is from Mott Capital Management and is being posted with its permission. The views expressed in this material are solely those of the author and/or Mott Capital Management and Interactive Brokers is not endorsing or recommending any investment or trading discussed in the material. This material is not and should not be construed as an offer to buy or sell any security. It should not be construed as research or investment advice or a recommendation to buy, sell or hold any security or commodity. This material does not and is not intended to take into account the particular financial conditions, investment objectives or requirements of individual customers. Before acting on this material, you should consider whether it is suitable for your particular circumstances and, as necessary, seek professional advice.
Related Articles
 Simulation")


")
Join The Conversation
For specific platform feedback and suggestions, please submit it directly to our team using these instructions.
If you have an account-specific question or concern, please reach out to Client Services.
We encourage you to look through our FAQs before posting. Your question may already be covered!