Oversold conditions don’t go away when the market transitions away from a bear market environment. What does change however is the behavioral response from investors to the weakness. In other words, what happens next determines the market regime.
In bear markets, oversold conditions generate even more selling, as pessimism dominates the behavioral response. This results in lower lows despite, or perhaps even because of, the oversold condition. This is depicted by the series of red arrows in Figure 1.
In bull markets, the very same oversold condition instead triggers confident, responsive buying. This is clearly (and thankfully) depicted by the green arrows in Figure 1.
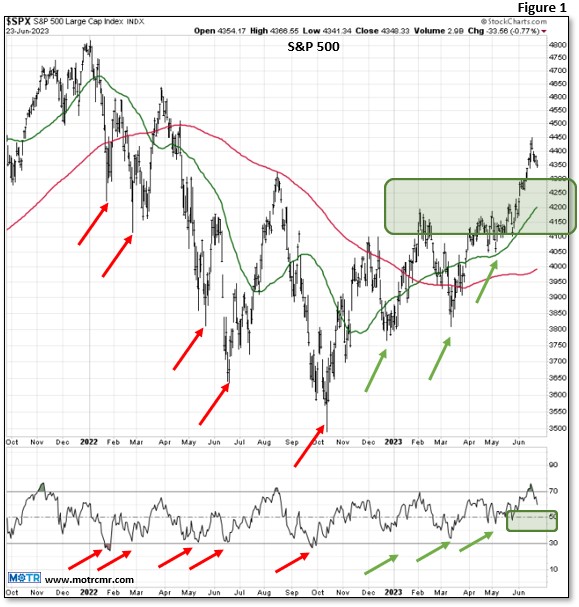
If you ever find your self struggling with an oversold condition, wondering if it is “good” or “bad”, just find the most recent oversold condition and ask yourself, “are we above or below that level?” If we’re above, the likelihood is that conditions are okay, or getting better. If below, they are bad or getting worse. Respond accordingly.
Of course, the opposite is true of overbought conditions. In bear markets, overbought conditions induce selling, but in bull markets, they induce more buying. Trends are nothing more than behaviorally charged responses to the ebb and flow of capital.
This concept is of particular importance today as the market seems to have run out of fuel from responsive buyers, at least for now. Again, this is perfectly normal and completely unavoidable. What is more important is how we respond to the next oversold condition.
If all is well (as we suspect it is), then the next oversold condition should be met by responsive buyers. The most probable area for the buyers to step in is 4200-4300, which acted as a ceiling for the market since last summer (Figure 1, large green box). If this is indeed a newly developing bull market, we should also not see momentum reach extremely oversold conditions. As such, RSI (lower panel) should induce buying somewhere between 30 and 50, as it has at every low since after the October bottom.
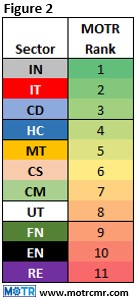
Adding to our expectations that bulls will resurface to produce the next oversold, higher low is the quality of current market leadership. As indicated in Figure 2, leadership is still very cyclical, and broadly participated. While most market observers are concerned about the fact that 10 Tech stocks are driving the market higher, the alternate reality is that Industrials, not Tech, is the number one rated sector in our work. Leadership breadth is more broad that most give it credit.
Finally, the top three sectors have each attained a level of “Risk On” in our Risk Gauges (Figure 3). This is extremely important because the market itself can NEVER reach “Risk On” unless and until leadership does so first. This is one of our “inviolable rules of trend following”. The fact that both IT and CD both show quarterly timeframes of the Risk Gauge in the lower end of “Mixed” reveals just how early we are in this bull market.
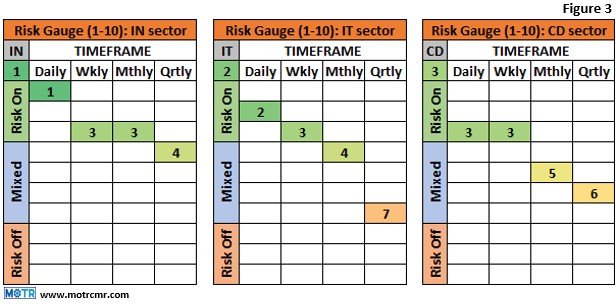
Industrials, which our systematic process flagged as an overweight last year, in the throes of the bear market, is not only number one, but the quarterly timeframe is just one notch below “Risk On”. With leadership within that sector undeniably cyclical and robust, we feel we have ample evidence to anticipate that the next oversold condition will induce buying, not selling.
Check out next Monday’s Weekly MOTR Report for our latest list of buy ideas among leadership sectors that are basing or emerging from bases.
—
Originally Posted June 23, 2023 – Charting My Interruption (CMI): “Response to weakness matters more than the weakness itself.”
Disclosure: Interactive Brokers Third Party
Information posted on IBKR Campus that is provided by third-parties does NOT constitute a recommendation that you should contract for the services of that third party. Third-party participants who contribute to IBKR Campus are independent of Interactive Brokers and Interactive Brokers does not make any representations or warranties concerning the services offered, their past or future performance, or the accuracy of the information provided by the third party. Past performance is no guarantee of future results.
This material is from MOTR Capital Management & Research and is being posted with its permission. The views expressed in this material are solely those of the author and/or MOTR Capital Management & Research and Interactive Brokers is not endorsing or recommending any investment or trading discussed in the material. This material is not and should not be construed as an offer to buy or sell any security. It should not be construed as research or investment advice or a recommendation to buy, sell or hold any security or commodity. This material does not and is not intended to take into account the particular financial conditions, investment objectives or requirements of individual customers. Before acting on this material, you should consider whether it is suitable for your particular circumstances and, as necessary, seek professional advice.








Join The Conversation
For specific platform feedback and suggestions, please submit it directly to our team using these instructions.
If you have an account-specific question or concern, please reach out to Client Services.
We encourage you to look through our FAQs before posting. Your question may already be covered!