After a protracted period of calm, volatility returned to markets in 2022—and has proven it’s here to stay in 2023. Investors are now looking to position portfolios for a potentially bumpy road ahead, leading to renewed interest in defensive strategies.
Low Volatility Factor (LVF) and Minimum Variance (Min Var) are two popular defensive strategies that are sometimes used interchangeably. However, they have very distinct objectives, construction methodologies, and investment outcomes.
Persistent market turbulence
Market fears were high in 2022, fueled by the triple threat of stubbornly high US inflation, the Fed’s relentless efforts to bring it under control by raising interest rates, and a rapidly deteriorating global economic outlook. The aftermath of the Russia-Ukraine war and China’s zero-coupon policy added to investor jitters.
While virtually no global market segment escaped the turmoil of the past year, US large cap equities were dealt a particularly sharp blow. The Russell 1000 Index plummeted -19.1% in 2022, and the Russell 1000 Volatility Factor Index came within mere basis points of its all-time high.[1]
The US equity market volatility has extended into 2023, as a series of US bank failures and recession fears triggered a massive flight from risk in March, keeping the Russell Volatility Factor Index at elevated levels. The risk-off environment continued into April, where defensive industries such as Consumer Staples and Healthcare were among the strongest performers.
Two distinct ways to play defence
As defensive industries have cycled into favor, the market turmoil has led many investors to seek a defensive stance in their broader US large-cap exposure. LVF and Min Var are two common approaches to this—but despite sharing defensive qualities, the strategies have distinctly different objectives and construction methodologies.
LVF and Min Var are both defensive strategies in that they use volatility metrics to build portfolios that exhibit lower volatility than the market-cap weighted benchmark. However, the primary objective of LVF strategies is to enhance return relative to the benchmark, while Min Var strategies aim to reduce total portfolio volatility.
LVF strategies seek to capture the historical premium associated with the low volatility effect,[2] thereby offering the potential for enhanced return. As such, they’re built to tilt away from the benchmark by overweighting less volatile stocks. By contrast, Min Var strategies consider both volatility and correlation between stocks, and then optimize the portfolio with the objective of minimizing total volatility.

Different objectives drive different outcomes
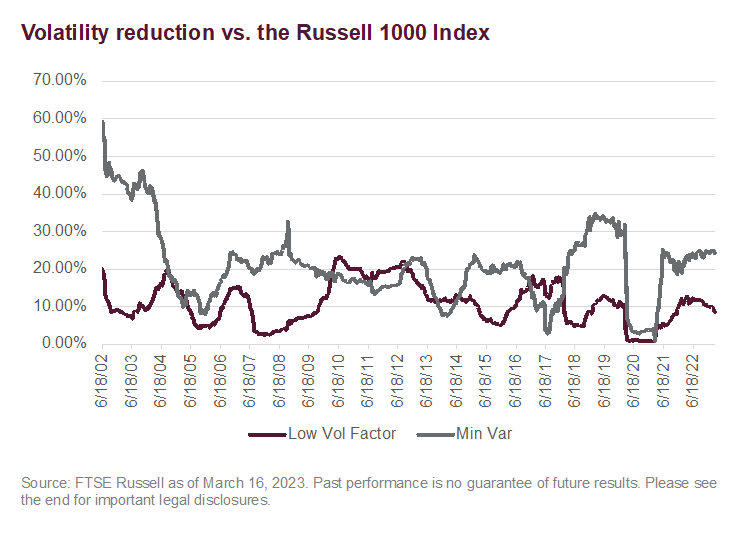
Differing objectives and construction methodologies have resulted in considerably different risk and return outcomes. As shown, over the past 20 years, the Russell 1000 Minimum Variance Index has achieved its primary objective of volatility reduction relative to the Russell 1000 Index.

While the Russell Low Volatility Factor Index also offered volatility reduction, it was generally to a lesser extent—particularly at times of heightened market turbulence, such as during the 2008 Global Financial Crisis (GFC), and the 2020 onset of the pandemic.
Volatility calculation methodology matters
The two index methodologies also differ with respect to how they calculate volatility when screening potential constituent stocks—and this can have a material impact on performance outcomes. While the Min Var index uses two years of daily returns observations to calculate a stock’s standard deviation, the LVF index uses five years of weekly returns. As such, the Min Var index captures more market momentum while the LVF Index’s less frequent observations over a longer period make for a smoother ride.
Two types of shelter from the storm
The current macroeconomic regime has investors sharpening their focus on controlling portfolio risk, but there can be considerable confusion when it comes to discerning between popular defensive strategies. While LVF and Min Var strategies can both be described as defensive, their varied objectives and composition make them distinctly different approaches to defensive positioning.
As LVF seeks return enhancement through its exposure to the Low Volatility Factor, it can be considered a standard factor investment approach that may be best combined with other return-enhancing factor strategies. Min Var, however, continues to meet its objective of reducing portfolio volatility—demonstrating its potential to offer protection from adverse market shocks.
For more on the performance of equities and other asset classes, subscribe to the blog.
[1] Source: Eikon as of April 25, 2023
[2] Source: Haugen, R., and J. Heins. “On the Evidence Supporting the Existence of Risk Premiums in the Capital Market”, Wisconsin Working Paper, 1972. (SRN: https://ssrn.com/abstract=1783797)
—
Originally Posted May 18, 2023 – Playing defense: comparing US large cap volatility strategies
Disclosure: FTSE Russell
Interactive Advisors, a division of Interactive Brokers Group, offers FTSE Russell Index Tracker portfolios on its online investing marketplace. Learn more about the Diversified Portfolios.
This material is not intended as investment advice. Interactive Advisors or portfolio managers on its marketplace may hold long or short positions in the companies mentioned through stocks, options or other securities.
© 2023 London Stock Exchange Group plc and its applicable group undertakings (the “LSE Group”). The LSE Group includes (1) FTSE International Limited (“FTSE”), (2) Frank Russell Company (“Russell”), (3) FTSE Global Debt Capital Markets Inc. and FTSE Global Debt Capital Markets Limited (together, “FTSE Canada”), (4) MTSNext Limited (“MTSNext”), (5) Mergent, Inc. (“Mergent”), (6) FTSE Fixed Income LLC (“FTSE FI”), (7) The Yield Book Inc (“YB”) and (8) Beyond Ratings S.A.S. (“BR”). All rights reserved.
FTSE Russell® is a trading name of FTSE, Russell, FTSE Canada, MTSNext, Mergent, FTSE FI, YB and BR. “FTSE®”, “Russell®”, “FTSE Russell®”, “MTS®”, “FTSE4Good®”, “ICB®”, “Mergent®”, “The Yield Book®”, “Beyond Ratings®“ and all other trademarks and service marks used herein (whether registered or unregistered) are trademarks and/or service marks owned or licensed by the applicable member of the LSE Group or their respective licensors and are owned, or used under licence, by FTSE, Russell, MTSNext, FTSE Canada, Mergent, FTSE FI, YB or BR. FTSE International Limited is authorised and regulated by the Financial Conduct Authority as a benchmark administrator.
All information is provided for information purposes only. All information and data contained in this publication is obtained by the LSE Group, from sources believed by it to be accurate and reliable. Because of the possibility of human and mechanical error as well as other factors, however, such information and data is provided “as is” without warranty of any kind. No member of the LSE Group nor their respective directors, officers, employees, partners or licensors make any claim, prediction, warranty or representation whatsoever, expressly or impliedly, either as to the accuracy, timeliness, completeness, merchantability of any information or of results to be obtained from the use of the FTSE Russell products, including but not limited to indexes, data and analytics or the fitness or suitability of the FTSE Russell products for any particular purpose to which they might be put. Any representation of historical data accessible through FTSE Russell products is provided for information purposes only and is not a reliable indicator of future performance.
No responsibility or liability can be accepted by any member of the LSE Group nor their respective directors, officers, employees, partners or licensors for (a) any loss or damage in whole or in part caused by, resulting from, or relating to any error (negligent or otherwise) or other circumstance involved in procuring, collecting, compiling, interpreting, analysing, editing, transcribing, transmitting, communicating or delivering any such information or data or from use of this document or links to this document or (b) any direct, indirect, special, consequential or incidental damages whatsoever, even if any member of the LSE Group is advised in advance of the possibility of such damages, resulting from the use of, or inability to use, such information.
No member of the LSE Group nor their respective directors, officers, employees, partners or licensors provide investment advice and nothing contained herein or accessible through FTSE Russell products, including statistical data and industry reports, should be taken as constituting financial or investment advice or a financial promotion.
Past performance is no guarantee of future results. Charts and graphs are provided for illustrative purposes only. Index returns shown may not represent the results of the actual trading of investable assets. Certain returns shown may reflect back-tested performance. All performance presented prior to the index inception date is back-tested performance. Back-tested performance is not actual performance, but is hypothetical. The back-test calculations are based on the same methodology that was in effect when the index was officially launched. However, back- tested data may reflect the application of the index methodology with the benefit of hindsight, and the historic calculations of an index may change from month to month based on revisions to the underlying economic data used in the calculation of the index.
This document may contain forward-looking assessments. These are based upon a number of assumptions concerning future conditions that ultimately may prove to be inaccurate. Such forward-looking assessments are subject to risks and uncertainties and may be affected by various factors that may cause actual results to differ materially. No member of the LSE Group nor their licensors assume any duty to and do not undertake to update forward-looking assessments.
No part of this information may be reproduced, stored in a retrieval system or transmitted in any form or by any means, electronic, mechanical, photocopying, recording or otherwise, without prior written permission of the applicable member of the LSE Group. Use and distribution of the LSE Group data requires a licence from FTSE, Russell, FTSE Canada, MTSNext, Mergent, FTSE FI, YB, BR and/or their respective licensors.
Disclosure: Interactive Brokers Third Party
Information posted on IBKR Campus that is provided by third-parties does NOT constitute a recommendation that you should contract for the services of that third party. Third-party participants who contribute to IBKR Campus are independent of Interactive Brokers and Interactive Brokers does not make any representations or warranties concerning the services offered, their past or future performance, or the accuracy of the information provided by the third party. Past performance is no guarantee of future results.
This material is from FTSE Russell and is being posted with its permission. The views expressed in this material are solely those of the author and/or FTSE Russell and Interactive Brokers is not endorsing or recommending any investment or trading discussed in the material. This material is not and should not be construed as an offer to buy or sell any security. It should not be construed as research or investment advice or a recommendation to buy, sell or hold any security or commodity. This material does not and is not intended to take into account the particular financial conditions, investment objectives or requirements of individual customers. Before acting on this material, you should consider whether it is suitable for your particular circumstances and, as necessary, seek professional advice.


Join The Conversation
For specific platform feedback and suggestions, please submit it directly to our team using these instructions.
If you have an account-specific question or concern, please reach out to Client Services.
We encourage you to look through our FAQs before posting. Your question may already be covered!