A portfolio investment return is typically divided into two components: price appreciation of the underlying securities and distributions or dividends paid out to investors. Holding a group of securities with high dividend payout is beneficial, but it’s equally important for companies to have a consistent track record of maintaining or growing their dividends. In this article, we will provide an update on the North American dividend landscape, with a focus on Canadian companies. We will also explore the S&P/TSX Canadian Dividend Aristocrats Index, which aims to capture both sustainable dividends and capital appreciation – some of the key factors in investors’ total return expectations. The index is designed to offer diversification across all sectors and exhibits both growth and value characteristics.
2024 Dividend Update
Dividend announcements are on the up and up in 2024, with 13,433 publicly traded companies in Wall Street Horizon’s worldwide universe rewarding shareholders with a dividend offering year-to-date. This is compared to the 13,393 announcements recorded by this point in 2023. Of those, 14% of dividend payouts were decreases from prior amounts, 29% were increases and 57% were unchanged.
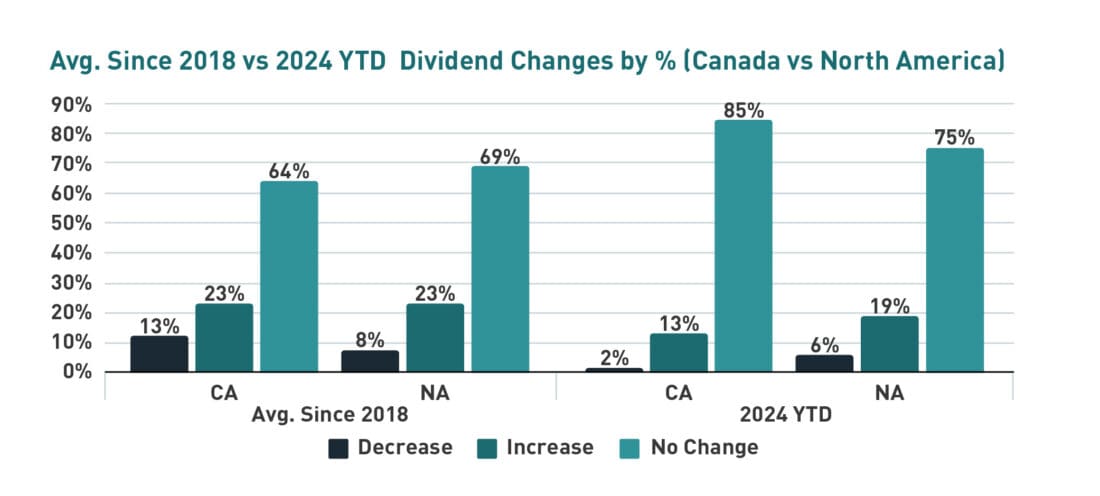
When just looking at North American companies, however, the trend is reversed, with 8,454 publicly traded companies offering dividends so far this year vs. 8,538 announcements at this point in 2023. Only 6% of those were decreases, 19% were increases and 75% of companies kept their dividends payouts the same.
Canadian companies were the group that changed dividend payments the least. Year-to-date, 1,553 companies have announced dividends, vs.1,588 announcements in 2023. Of those, 2% of those were decreases, 13% were increases and 85% of Canadian corporations kept their dividend payouts the same.

While the number of publicly traded companies offering dividends has improved overall, the percentage of those that increased payouts this year is less than the 7-year average in North America and Canada; worldwide payouts are in-line with the average over that time. Since 2018, 8% of North American dividend announcements were decreases from prior levels, 23% were increases and 69% were unchanged. Similarly, over the same period, 13% of Canadian dividend announcements were decreases, 23% were increases and 64% were unchanged.
Dividends payouts (along with share buybacks) are one of the primary vehicles that companies use to return value to shareholders. For this reason it is a positive sign to see an increase in the number of companies offering dividends in 2024 after many companies remained cautious last year in the face of higher interest rates, stubbornly elevated levels of inflation and the threat of an impending recession. Unsure of whether a soft-landing was in store for the US, companies held back on returning excess profits to investors. Dividends benefit investors by providing income, but also work as a gauge for the company’s financial well-being. For this reason, high dividend payers tend to be very in demand.
Highlighting S&P/TSX Canadian Dividend Aristocrats Index
S&P/TSX Canadian Dividend Aristocrats Index (launched on August 1, 2008) is not a typical index that merely includes high dividend-yielding securities as of the latest period. Instead, it aims to include companies that have maintained or increased their dividends every year for at least five years. As a result, the index aims to focus not only on high-dividend-paying companies but also on those with a strong track record of stable or growing dividends, typically linked to robust earning power and sound management capabilities.
Many dividend factor indices group companies by their current or trailing highest dividend yields, but this doesn’t necessarily indicate strong financials to support continued high payouts. Investors often chase high-yielding companies, which can lead to a “dividend trap,” where an attractive initial yield masks underlying financial instability and lower future profitability. This can result in both capital and income losses when the company fails to sustain its dividend payouts.
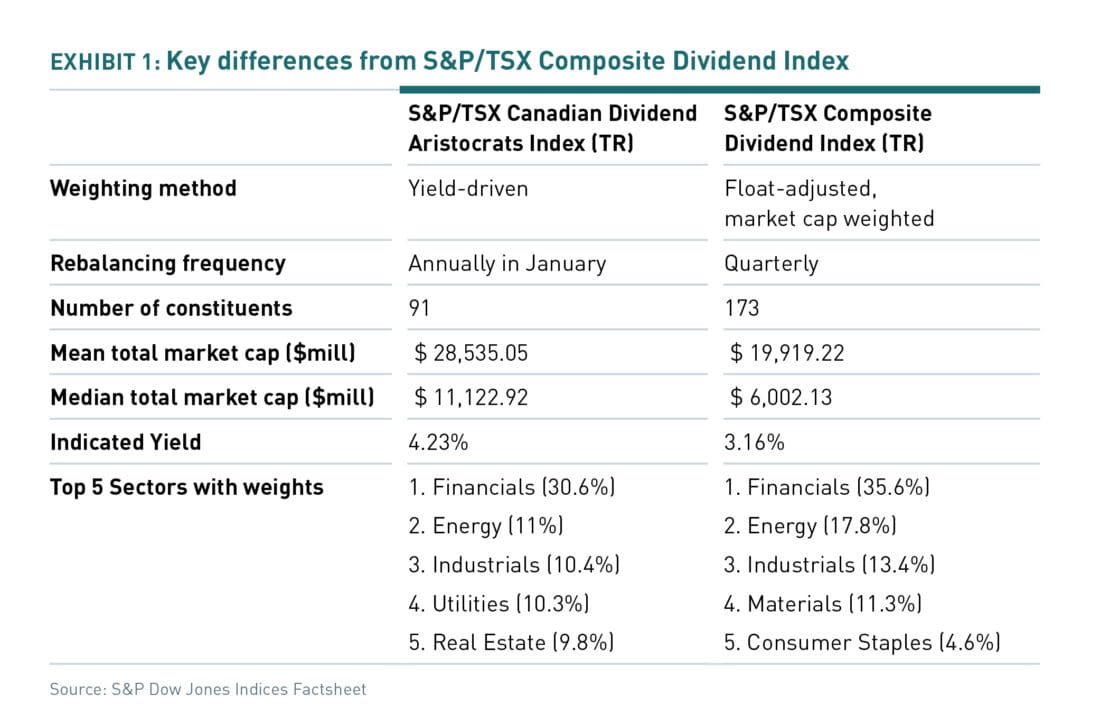
Exhibit 1 highlights key differences between the S&P/TSX Canadian Dividend Aristocrats Index and the S&P/TSX Composite Dividend Index. These differences range from index methodology to various index summary statistics. Notably, the S&P/TSX Canadian Dividend Aristocrats Index weights securities based on yield, has a higher concentration of securities, and offers an overall higher indicated yield, leading to different sector allocations. The distinctions between these two indices, despite their similar mandates, underscore the unique position of the S&P/TSX Canadian Dividend Aristocrats Index within the S&P/TSX suite of dividend-focused indices.

Performance in bear markets
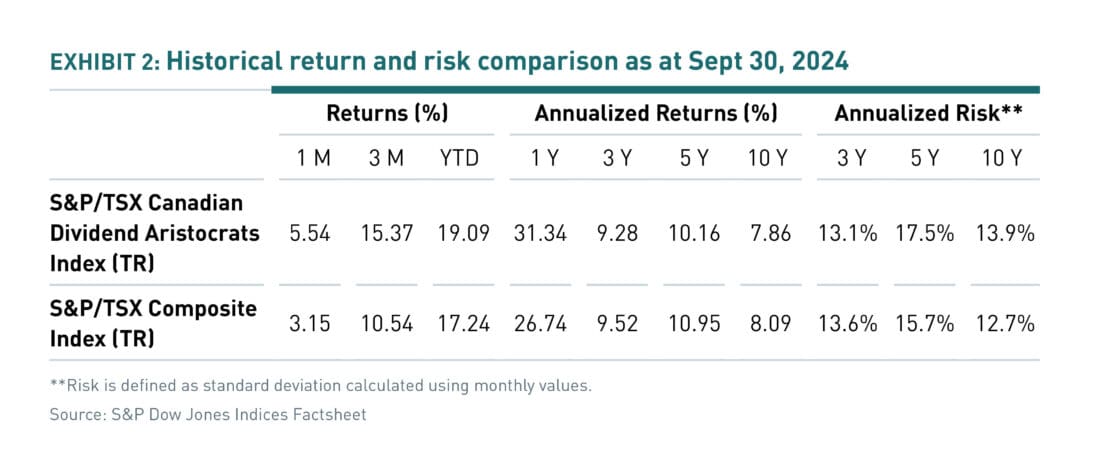
Compared to the S&P/TSX Composite Index, the S&P/TSX Canadian Dividend Aristocrats Index has outperformed the broad market index by nearly 5% over the past year (Exhibit 2). However, over a longer time horizon, its total return performance has slightly lagged behind the S&P/TSX Composite Index, with a 0.8% difference over five years. The S&P/TSX Dividend Aristocrats Index also demonstrates higher annualized risk over five- and ten-year periods.
This can be partly attributed to its more concentrated nature, as it includes about 40% fewer constituents than the Composite Index and tends to have a bias toward large-cap firms, with a median market cap of $11.1 billion compared to $4.7 billion for the Composite Index.

The true strength of companies with sustainable dividend growth is most evident during periods of market turmoil.
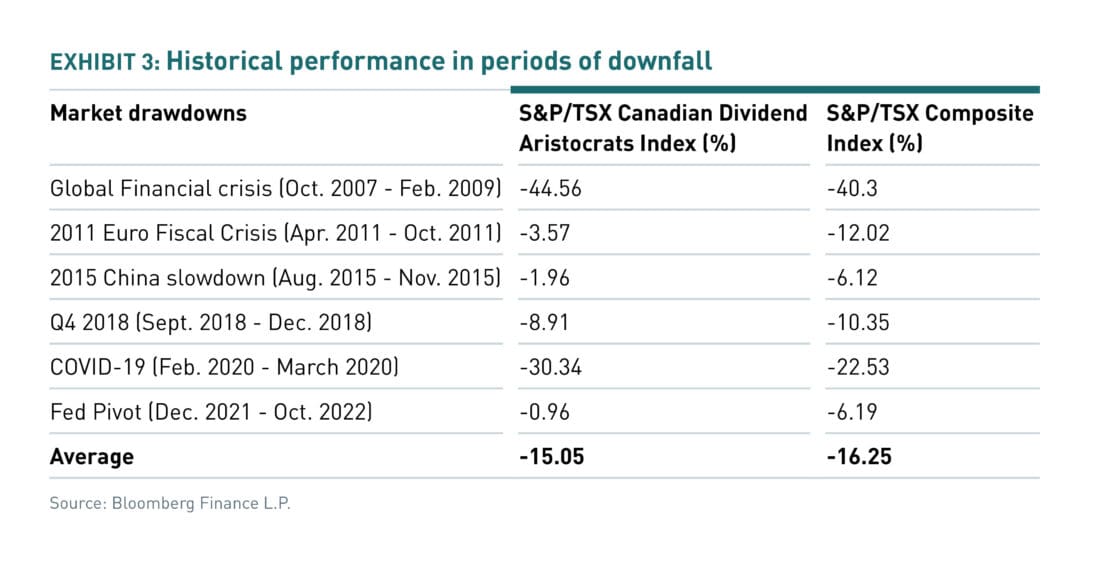
Exhibit 3 compares the returns of S&P/TSX Canadian Dividend Aristocrats Index with those of the S&P/TSX Composite Index during significant market downturns that affected not only the Canadian financial market but also the global economy. Aside from the global financial crisis and COVID-19, the S&P/TSX Dividend Aristocrats Index has outperformed in every major market drawdown, often by significant margins. Across six unique periods of drawdowns, the S&P/TSX Canadian Dividend Aristocrats Index provided an average excess return of 1.2% compared to the S&P/TSX Composite Index. This highlights the index’s ability to offer better downside protection during market downturns.

Source: Unless otherwise noted, Wall Street Horizon data as at November 14, 2024.
For more information, please contact TMX Sales at datasales@tmx.com.
For more information about Wall Street Horizon, please visit: https://www.wallstreethorizon.com/
For more information about S&P/TSX index suite, please visit: https://www.tmxinfoservices.com/benchmarks-and-indices/sp-tsx-indices#tsx
—
DISCLAIMER
The S&P/TSX Indices are products of S&P Dow Jones Indices LLC (“SPDJI”) and TSX Inc. (“TSX”). S&P® and Dividend Aristocrats® are registered trademarks of S&P Global, Inc. or its affiliates (“S&P”); Dow Jones® is a registered trademark of Dow Jones Trademark Holdings LLC (“Dow Jones”); and TSX® is a registered trademark of TSX. SPDJI, Dow Jones, S&P and TSX do not sponsor, endorse, sell or promote any products based on the Indices and none of such parties make any representation regarding the advisability of investing in such product(s) nor do they have any liability for any errors, omissions or interruptions of the Indices or any data related thereto.
The views and opinions expressed in this article are those of TSX, Inc. and do not necessarily reflect the views and opinions of S&P, Dow Jones, or their affiliates
Copyright © 2024 Wall Street Horizon, Inc. All rights reserved. Do not copy, distribute, sell or modify this document without Wall Street Horizon’s prior written consent. This information is provided for information purposes only. Wall Street Horizon, Inc. is an affiliate of TSX Inc. Neither TMX Group Limited nor any of its affiliated companies guarantees the completeness of the information contained in this publication, and we are not responsible for any errors or omissions in or your use of, or reliance on, the information. This publication is not intended to provide legal, accounting, tax, investment, financial or other advice and should not be relied upon for such advice. The information provided is not an invitation to purchase securities, including any listed on Toronto Stock Exchange and/or TSX Venture Exchange. TMX Group and its affiliated companies do not endorse or recommend any securities referenced in this publication. TMX, the TMX design, TMX Group, Toronto Stock Exchange, TSX, and TSX Venture Exchange are the trademarks of TSX Inc. and are used under license. Wall Street Horizon is the trademark of Wall Street Horizon, Inc. All other trademarks used in this publication are the property of their respective owners.
Disclosure: Toronto Stock Exchange
Copyright © 2023 TSX Inc. All rights reserved. Do not copy, distribute, sell or modify this document without TSX Inc.’s prior written consent. This information is provided for information purposes only. Neither TMX Group Limited nor any of its affiliated companies guarantees the completeness of the information contained in this publication, and we are not responsible for any errors or omissions in or your use of, or reliance on, the information. This publication is not intended to provide legal, accounting, tax, investment, financial or other advice and should not be relied upon for such advice. The information provided is not an invitation to purchase securities listed on Toronto Stock Exchange,TSX Venture Exchange and/or Montreal Exchange. TMX Group and its affiliated companies do not endorse or recommend any securities referenced in this publication. TMX, the TMX design, The Future is Yours to See., Toronto Stock Exchange, TSX, TSX Venture Exchange, TSXV, and Voir le futur. Réaliser l’avenir. are the trademarks of TSX Inc.
Disclosure: Interactive Brokers Third Party
Information posted on IBKR Campus that is provided by third-parties does NOT constitute a recommendation that you should contract for the services of that third party. Third-party participants who contribute to IBKR Campus are independent of Interactive Brokers and Interactive Brokers does not make any representations or warranties concerning the services offered, their past or future performance, or the accuracy of the information provided by the third party. Past performance is no guarantee of future results.
This material is from Toronto Stock Exchange and is being posted with its permission. The views expressed in this material are solely those of the author and/or Toronto Stock Exchange and Interactive Brokers is not endorsing or recommending any investment or trading discussed in the material. This material is not and should not be construed as an offer to buy or sell any security. It should not be construed as research or investment advice or a recommendation to buy, sell or hold any security or commodity. This material does not and is not intended to take into account the particular financial conditions, investment objectives or requirements of individual customers. Before acting on this material, you should consider whether it is suitable for your particular circumstances and, as necessary, seek professional advice.


Join The Conversation
For specific platform feedback and suggestions, please submit it directly to our team using these instructions.
If you have an account-specific question or concern, please reach out to Client Services.
We encourage you to look through our FAQs before posting. Your question may already be covered!