
- Solve real problems with our hands-on interface
- Progress from basic puts and calls to advanced strategies
Interactive Options Course
Posted July 1, 2024 at 11:15 am
One of the running jokes among those of us who listen to earnings calls is the propensity of coverage analysts to lead their questions with something like “nice quarter”, regardless of whether the market is interpreting it as such. If the S&P 500 (SPX) and Nasdaq 100 (NDX) indices were stocks, they would indeed merit a “nice quarter” comment. But when we look at other US and global indices, that compliment should be dispensed more carefully.
The chart below shows how well those two metrics compare with other North American peers. Compared with the Russell 2000 (RTY), Dow Jones Industrial Average (INDU), and S&P TSX 60 (TSE60, SPTSX60), NDX’s +7.8% and SPX’s +3.9% compare very favorably with the roughly -2% to -4% losses shown by those other metrics.
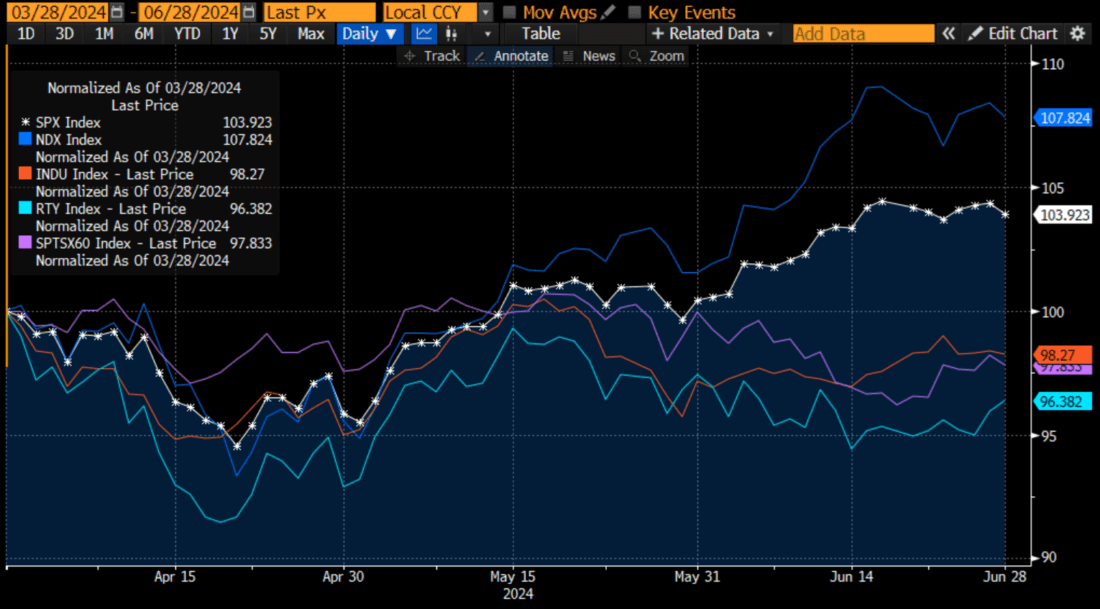
Source: Bloomberg
It doesn’t require too much imagination to figure out what led SPX higher last quarter. It was technology and anything else related to artificial intelligence, including the normally defensive utilities sector:

Source: Bloomberg
Considering that the USA is the home of the most prominent AI-related companies (I’m thinking of you, Nvidia (NVDA), it is hardly surprising that the key US indices have outperformed their major European peers. Among them, only the UK’s FTSE 100 Index (Z, UKX) is higher, perhaps buoyed by enthusiasm ahead of Thursday’s Parliamentary elections. France’s CAC 40 (CAC40, CAC) fell for precisely the opposite reason. Although we see a bit of a relief rally (~+1.5%) after the first round of their own elections indicated gridlock rather than a rout for opposition parties, the damage had already been done after early June’s European Parliament elections. Those also impacted Germany’s DAX (DAX) and thus the entire Euro Stoxx 50 (ESTX50, SX5E)
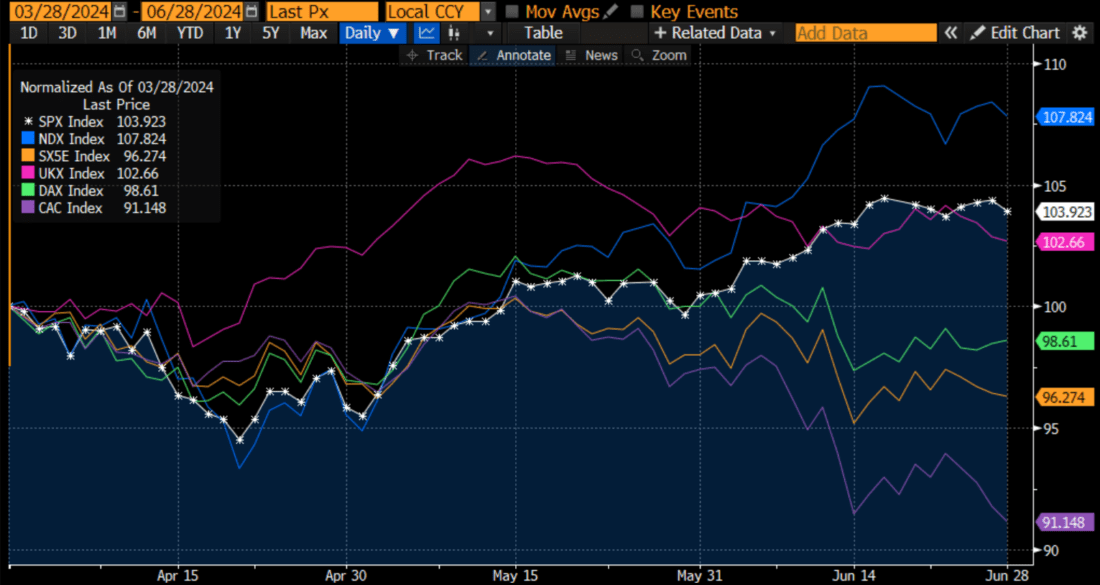
Source: Bloomberg
The story out of Asia is quite different. The Nikkei 225 (N225, NKY) and Australia’s S&P/ASX 200 (SPI, AS51) put in the same lackluster performances that we saw throughout much of the world this quarter. That said, the N225 is up a blistering 18% in (weaker) local currency terms on a year-to-date basis, so a minor stumble can be forgiven. Contrarily, Hong Kong’s Hang Seng Index (HSI) got off to a stellar start this quarter before giving back much of the gains in recent weeks. That said, even after last quarter’s +7% rise, that index is only up just under +4% year-to-date even after today’s 2% gain. India’s Nifty 50 Index (NIFTY) continued its string of advances, rising 7% after its own election-based jitters.
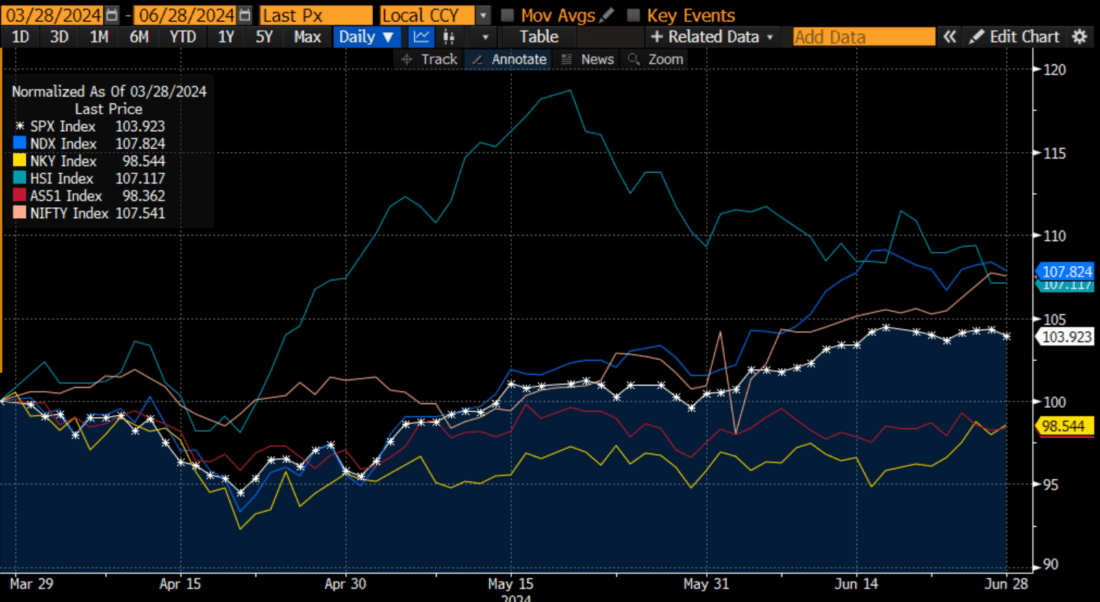
Source: Bloomberg
It is always useful to look back at the events of the past. While we all know that past performance does not indicate future results, it is informative to know what has been driving that performance and why. Can we continue to rely on megacap tech dominance? Certainly today’s performance indicates that we can try, with SPX and NDX higher at midday, powered by gains in Apple (AAPL), Amazon (AMZN), Microsoft (MSFT), and Tesla (TSLA) despite declining stocks roughly doubling advancers. This is nothing new, of course. The combination of hoped-for fresh money and “don’t short a dull tape” is enough to keep the usual winners afloat.
Keep in mind that part about the dull tape for the next couple of days and into Friday. In theory, this should be a somnolent holiday-shortened week. In reality, we already see Treasury yields pushing higher and curve steepening despite a weaker-than-expected ISM Manufacturing report and sharply lower Prices Paid. Remember also that we get Fed Minutes at 2pm EDT on Wednesday, after the stock market’s early close that day, and the monthly Employment Report on Friday morning after Thursday’s market closure. It may be dull now, but the fireworks might not be limited this week to July 4th.
New to Interactive Brokers?
Open AccountAlready an Interactive Brokers Client?
Request Trading PermissionThe analysis in this material is provided for information only and is not and should not be construed as an offer to sell or the solicitation of an offer to buy any security. To the extent that this material discusses general market activity, industry or sector trends or other broad-based economic or political conditions, it should not be construed as research or investment advice. To the extent that it includes references to specific securities, commodities, currencies, or other instruments, those references do not constitute a recommendation by IBKR to buy, sell or hold such investments. This material does not and is not intended to take into account the particular financial conditions, investment objectives or requirements of individual customers. Before acting on this material, you should consider whether it is suitable for your particular circumstances and, as necessary, seek professional advice.
The views and opinions expressed herein are those of the author and do not necessarily reflect the views of Interactive Brokers, its affiliates, or its employees.
For specific platform feedback and suggestions, please submit it directly to our team using these instructions.
If you have an account-specific question or concern, please reach out to Client Services.
We encourage you to look through our FAQs before posting. Your question may already be covered!
Related Articles


This is because most “analysts” are really salespeople who merely parrot what companies tell them in the form of “research.” Is it any surprise why most companies “beat” the analysts’ accounting and “adjusted EBITDA” forecasts?
Analysts are really salespeople.
I am not trolling you, but this piece has no content nor insight at all.
You are merely describing the chart, oh this went up, oh this went down , oh it went up because it has tech…etc.
tell us something we don’t know. meanwhile the media is flooded with analysts or whatever their title maybe telling people to put monies in these ‘bad’ areas. One has to feel sorry for the customers or account holders, dpending on your amounts invested, who have followed such advice.