
- Solve real problems with our hands-on interface
- Progress from basic puts and calls to advanced strategies
Interactive Options Course
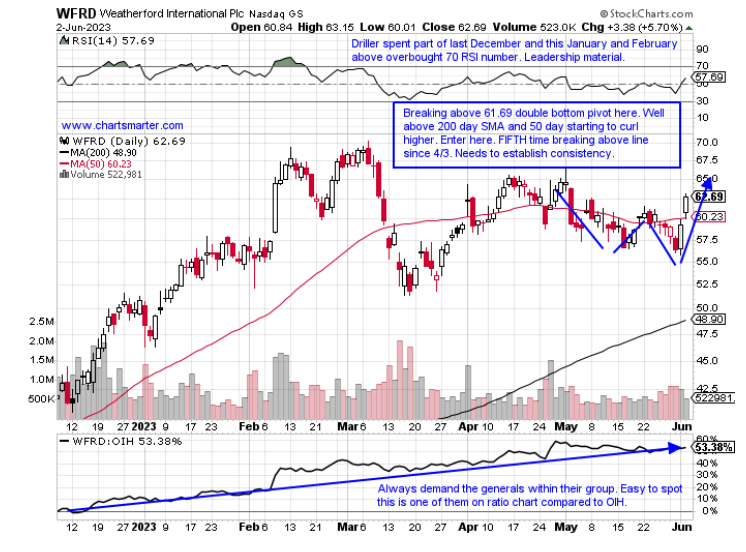
The drillers continue to be my preferred group if one is itching to enter this nascent energy move higher. Will the second half of 2023 be when the group sees some tailwinds? Of course, no one could be sure of that but as always you want to purchase best-in-breed names if you are making a bet on the space. Akin to playing your all-stars if you want to win a ballgame. You do not put forth your Triple AAA players. While the larger names tend to dominate the headlines in the services arena with SLB and HAL being 21 and 28% off their most recent 52-week highs, the chart below of WFRD is just 11% off its annual peak (do not write off BORR which is drilling in on a 7.72 cup with handle pivot, pun intended). Its WEEKLY chart sports a bull flag which began with a bullish morning star pattern completed the week ending 7/29/22 that witnessed the stock accelerate higher by more than 30%. The daily chart here does show a move above a double bottom pivot of 61.69 and look for a potential move back to the round 70 number in the near term where it was soundly rejected on 3/7 with a bearish engulfing candle.
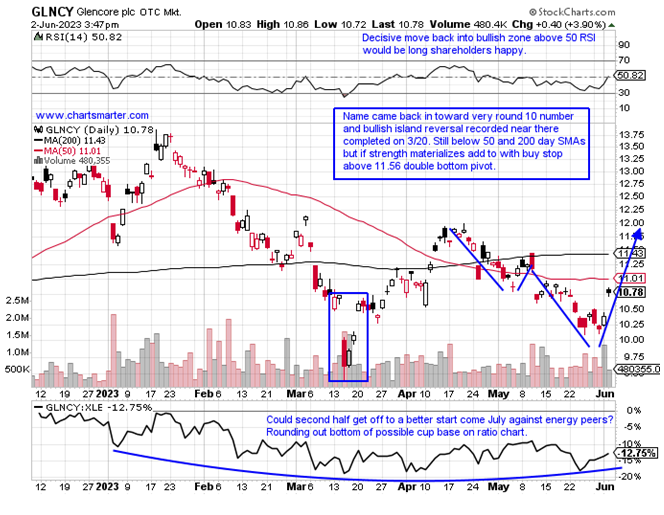
Long-time readers of mine know my affinity with round number theory and below is a name not only an energy play but involved in materials as well which were the best-performing major S&P sector. GLNCY may have recorded a double bottom at the 10-figure to escape single-digit status with the mid-March lows and this past week. The stock is down 19% YTD but does carry a nice dividend yield of 6.5%. In 2023 it has advanced on a WEEKLY basis just 8 times, and there has not been an accumulation week since January when both weeks ending 1/13-20 rose by a combined 12%. On its MONTHLY chart, it found support around 9 which was a prior double top dating back to July 2014 and January 2018. It feels like that former ceiling is now a floor for the stock in the very long-term time frame. In my humble opinion if this name can get back above 11.50, I think it can make a sprint toward the 14 area where the name had trouble in late 2022. There one can reassess.
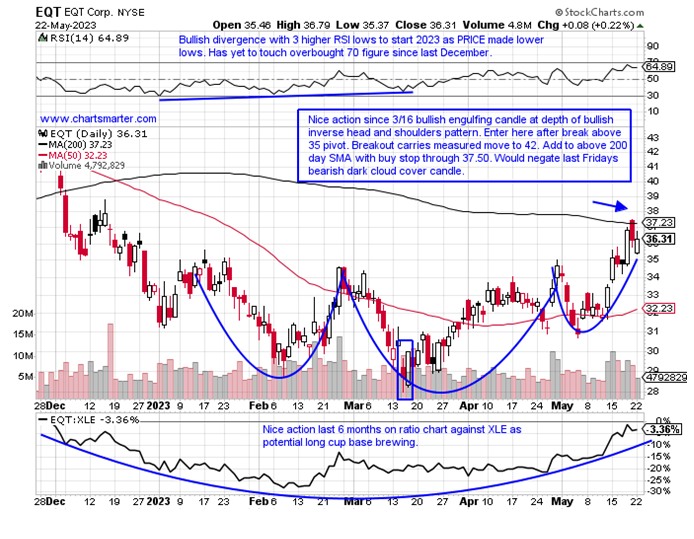
Natural gas stocks have seemed to buck the trend for now as the resource is leaning back toward the lower end of the $2-$3 range it has been in since February. RRC continues to have issues with the round 30 number since dropping below it the week ending 9/16 which fell below if dropping 4.5% then saw the very next week crater downward by 16%. The weeks ending 2/24 and 5/19 encountered 30 rising 20.8 and 11.2% before being rejected. Below is the chart of another name in the arena with EQT and how it appeared in our 5/23 Energy Note. It is now just above the suggested entry PRICE but not far from it and its bullish inverse head and shoulders pattern is still intact. It is just a few percent away from its 200-day SMA but a clear bullish signal would be if it could catapult that secular line. I still believe this name will gravitate toward the very round 50 number sometime in 2023. The last 3 weeks all CLOSED very taut within just .46 of each other and we know that type of coiling action tends to lead to explosive breakouts.
—
Originally Posted June 5, 2023
The opinions expressed by the author are his own. Trades or positions discussed by the author are neither a solicitation to buy or sell a security, nor are they investment advice. Recipients should always do their own due diligence before buying or selling a security. Every reader is responsible for his/her decision to buy or sell a security.
Information posted on IBKR Campus that is provided by third-parties does NOT constitute a recommendation that you should contract for the services of that third party. Third-party participants who contribute to IBKR Campus are independent of Interactive Brokers and Interactive Brokers does not make any representations or warranties concerning the services offered, their past or future performance, or the accuracy of the information provided by the third party. Past performance is no guarantee of future results.
This material is from ChartSmarter and is being posted with its permission. The views expressed in this material are solely those of the author and/or ChartSmarter and Interactive Brokers is not endorsing or recommending any investment or trading discussed in the material. This material is not and should not be construed as an offer to buy or sell any security. It should not be construed as research or investment advice or a recommendation to buy, sell or hold any security or commodity. This material does not and is not intended to take into account the particular financial conditions, investment objectives or requirements of individual customers. Before acting on this material, you should consider whether it is suitable for your particular circumstances and, as necessary, seek professional advice.
Futures are not suitable for all investors. The amount you may lose may be greater than your initial investment. Before trading futures, please read the CFTC Risk Disclosure. A copy and additional information are available at ibkr.com.
Related Articles


Join The Conversation
For specific platform feedback and suggestions, please submit it directly to our team using these instructions.
If you have an account-specific question or concern, please reach out to Client Services.
We encourage you to look through our FAQs before posting. Your question may already be covered!