
- Solve real problems with our hands-on interface
- Progress from basic puts and calls to advanced strategies
Interactive Options Course
Posted February 19, 2025 at 10:30 am
Dear Investor ,
You have probably heard about the tragic plane crashes in recent weeks. But as an investor , you may also be interested in how the share price of aircraft manufacturers such as Boeing behaves after such air crashes. In the past, incidents such as the crash of Lion Air Flight 610 (2018) and Ethiopian Airlines Flight 302 (2019) have led to significant market reactions. We want to analyze the situation in more detail .
A study of share price performance after nine serious airplane accidents in the last ten years shows an average price drop of 2.67%. The reaction is usually immediate as investors respond to safety concerns, regulatory scrutiny and potential legal consequences. The chart shows you the typical development of the Boeing share price around crash days.
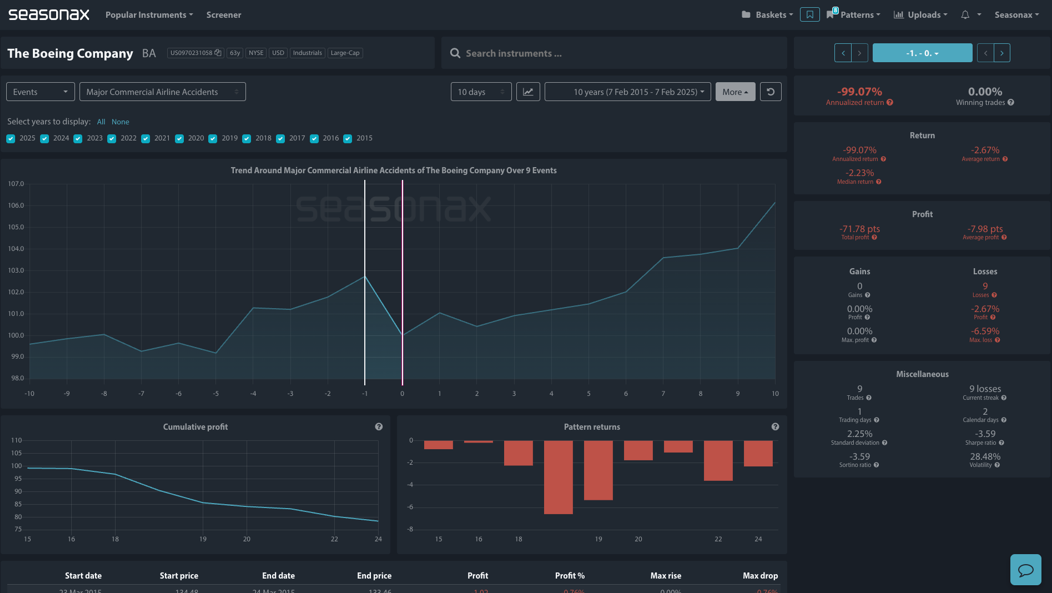
Key figures:
These figures make it clear that serious airplane accidents represent a significant downside risk for Boeing shares. The Seasonax filter option can also be used to analyze how accidents involving structural problems on Boeing aircraft specifically affect the share price.
While airplane accidents generally have a negative impact on Boeing shares, the consequences are particularly serious when they are due to technical or structural defects in Boeing airplanes.
Historically, accidents such as the crash of Lion Air Flight 610 (2018) and Ethiopian Airlines Flight 302 (2019), both of which were linked to problems with the 737 MAX’s MCAS system, led to massive price losses. These events resulted in a worldwide flight ban for the affected model series and caused significant market value losses for Boeing.
Other cases such as Southwest Flight 1380 (2018), which raised concerns about engine safety, or the crash of China Eastern Flight 5735 (2022), the cause of which remained unclear, also led to mistrust of the structural integrity of Boeing aircraft.
A targeted analysis shows that Boeing stock suffers significantly greater and longer-lasting losses after accidents caused by design or system deficiencies than after crashes caused by pilot error or weather conditions.
A seasonal analysis of share price performance following accidents involving Boeing-specific design flaws shows an annualized return of -99.87%, with 100% of these events resulting in losses.
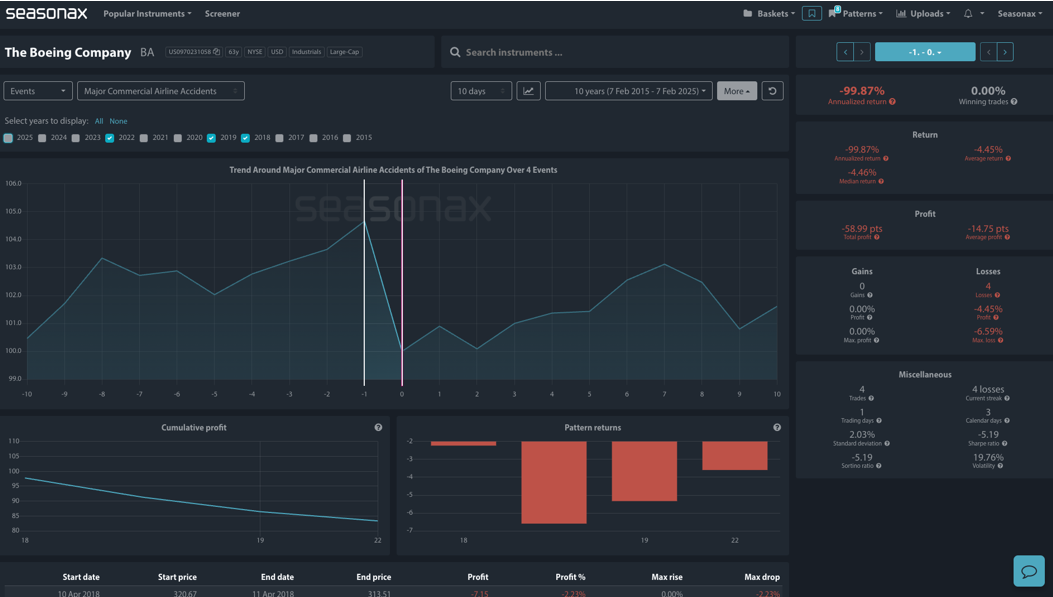
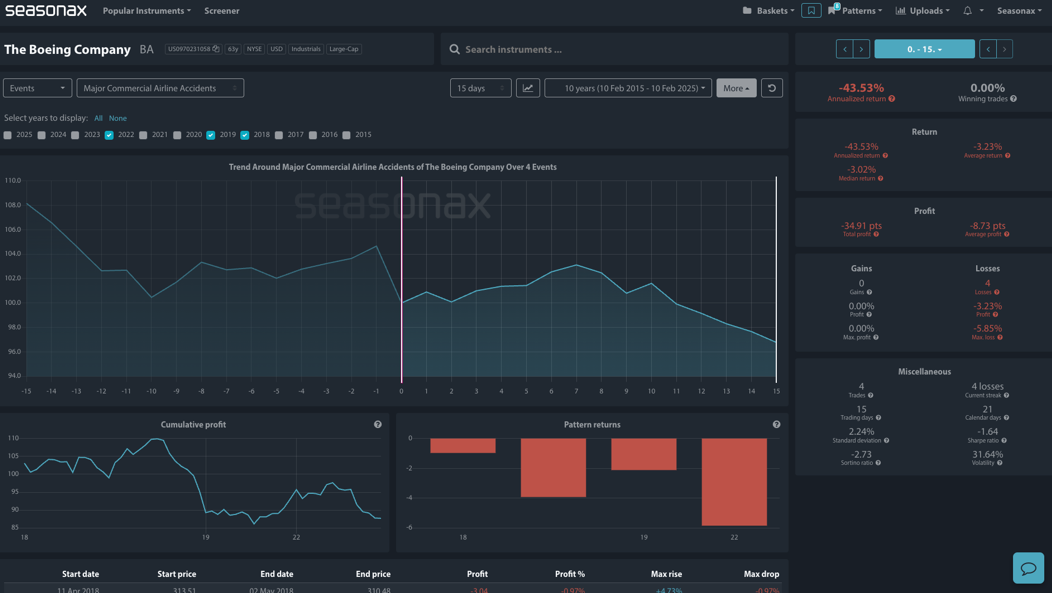
The share price usually falls sharply immediately after the accident as investors react with concern to official investigations and possible production stoppages. In contrast to more general airplane crashes, where losses are often limited, technical problems with Boeing aircraft lead to more severe and longer-lasting price drops. The analysis also shows that these losses tend to persist: In the 15 days following the event, Boeing shares remained under pressure, losing an average of 5.85%.
Boeing shares remain vulnerable to negative headlines, with major airplane accidents triggering significant short-term selling pressure. Data shows that accidents caused by Boeing’s systemic design flaws have a more severe impact than general aviation incidents.
When structural or software-related problems such as the 737 MAX’s MCAS system occur, deeper share price losses, longer regulatory scrutiny and a delayed recovery can be expected. Investors and traders can use these seasonal patterns to better gauge how Boeing stock might perform after technical incidents.
Use Seasonax for your professional handling of market-moving events!
—
Originally Posted February 19, 2025 – Boeing and Airplane Accidents: A Seasonal Analysis
Past results and past seasonal patterns are no indication of future performance, in particular, future market trends. Seasonax GmbH neither recommends nor approves of any particular financial instrument, group of securities, segment of industry, analysis interval or any particular idea, approach, strategy or attitude nor provides consulting nor brokerage nor asset management services. Seasonax GmbH hereby excludes any explicit or implied trading recommendation, in particular, any promise, implication or guarantee that profits are earned and losses excluded, provided, however, that in case of doubt, these terms shall be interpreted in abroad sense. Any information provided by Seasonax GmbH or on this website or any other kind of data media shall not be construed as any kind of guarantee, warranty or representation, in particular as set forth in a prospectus. Any user is solely responsible for the results or the trading strategy that is created, developed or applied. Indicators, trading strategies and functions provided by seasonax GmbH or on this website or any other kind of data media may contain logical or other errors leading to unexpected results, faulty trading signals and/or substantial losses. Seasonax GmbH neither warrants nor guarantees the accuracy, completeness, quality, adequacy or content of the information provided by it or on this website or any other kind of data media. Any user is obligated to comply with any applicable capital market rules of the applicable jurisdiction. All published content and images on this website or any other kind of data media are protected by copyright. Any duplication, processing, distribution or any form of utilisation beyond the scope of copyright law shall require the prior written consent of the author or authors in question. Futures and forex trading contains substantial risk and is not for every investor. An investor could potentially lose all or more than the initial investment. Risk capital is money that can be lost without jeopardizing ones’ financial security or lifestyle. Only risk capital should be used for trading and only those with sufficient risk capital should consider trading. Past performance is not necessarily indicative of future results. Testimonials appearing on this website may not be representative of other clients or customers and is not a guarantee of future performance or success.
Information posted on IBKR Campus that is provided by third-parties does NOT constitute a recommendation that you should contract for the services of that third party. Third-party participants who contribute to IBKR Campus are independent of Interactive Brokers and Interactive Brokers does not make any representations or warranties concerning the services offered, their past or future performance, or the accuracy of the information provided by the third party. Past performance is no guarantee of future results.
This material is from Seasonax and is being posted with its permission. The views expressed in this material are solely those of the author and/or Seasonax and Interactive Brokers is not endorsing or recommending any investment or trading discussed in the material. This material is not and should not be construed as an offer to buy or sell any security. It should not be construed as research or investment advice or a recommendation to buy, sell or hold any security or commodity. This material does not and is not intended to take into account the particular financial conditions, investment objectives or requirements of individual customers. Before acting on this material, you should consider whether it is suitable for your particular circumstances and, as necessary, seek professional advice.
Related Articles


Join The Conversation
For specific platform feedback and suggestions, please submit it directly to our team using these instructions.
If you have an account-specific question or concern, please reach out to Client Services.
We encourage you to look through our FAQs before posting. Your question may already be covered!