
- Solve real problems with our hands-on interface
- Progress from basic puts and calls to advanced strategies
Interactive Options Course
Posted December 11, 2024 at 10:30 am
The close of another eventful year in the financial markets approaches. Focus now shifts to a seasonal phenomenon that has intrigued investors for decades: the Santa Claus Rally. Known for its tendency to boost stock prices during the final trading days of December and the early days of January, this rally is once again in the spotlight.
With the S&P 500 delivering robust gains in 2024, the question remains: Will this year follow the pattern, or are we in for surprises?
There are clearly significant uncertainties ahead. On the one hand, under president-elect Trump’s incoming policies, the U.S. economy is expected to see tax cuts and deregulation, fuelling short-term growth, which could boost the S&P500. On the other hand, worsening global growth dynamics (particularly China’s slowdown as well as potential trade and tariff disputes with Europe) could create headwinds challenging the recent U.S. economic momentum. Also, the path of US interest rates will be pivotal. On December 18 the Federal Reserve will release their summary of economic projections; a lower path for interest rates for 2025 could boost the S&P500 into the year end.
So, there are compelling market uncertainties ahead that this seasonal trend will have to contend with. However, the Santa Claus Rally seasonal pattern has weathered periods of uncertainty before!
Historically, December has been a standout month for markets, offering high average returns, steady gains, and low volatility—especially during election years.
This year, the S&P 500 rally is being fueled by a combination of positive seasonality, the possibility of Federal Reserve rate cuts, and resilient consumer spending.
Starting around December 20 and typically ending on January 6 (highlighted in dark blue on the chart), this period has delivered some of the most impressive short-term returns in market history.
What is most astonishing is that over the last 96 years the Santa Claus Rally generated S&P500 an annualized return of 50.80%, delivered in only 11 trading days. By comparison, the average annualized return for the rest of the year is a modest 3.93%.
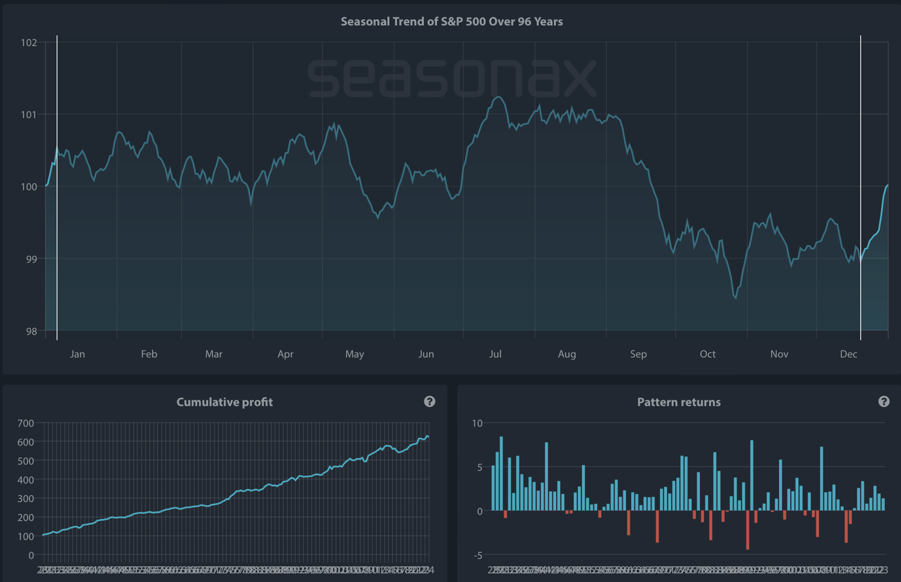
Source: Seasonax
Unlike regular charts, a seasonal chart doesn’t display price over a set time, but shows the average trend over several years. The horizontal axis represents the time of the year, and the vertical axis shows the % change in price (indexed to 100). The prices reflect end of day prices and do not include daily price fluctuations.
In short, the seasonal rally around the Christmas holidays is quite extraordinary. Moreover, looking at the pattern returns of every single year since 1928, prices rose almost 80% of the time (meaning that only 19 years out of 96 brought losses during the highlighted period). As this detailed breakdown of the S&P500 illustrates, blue bars clearly dominate, both in frequency and extent.
The Santa Claus Rally isn’t limited to the U.S. markets. Germany’s DAX, one of Europe’s leading indices, also benefits from seasonal tailwinds during December and early January.
The rally in the DAX typically begins on December 14 and extends until January 6, offering a slightly longer window of opportunity compared to the S&P 500.
Over the past 44 years, the DAX has delivered an average return of 2.85% during the rally period. This trend has repeated itself in 34 out of 44 years, making it a consistent opportunity for investors in European markets.
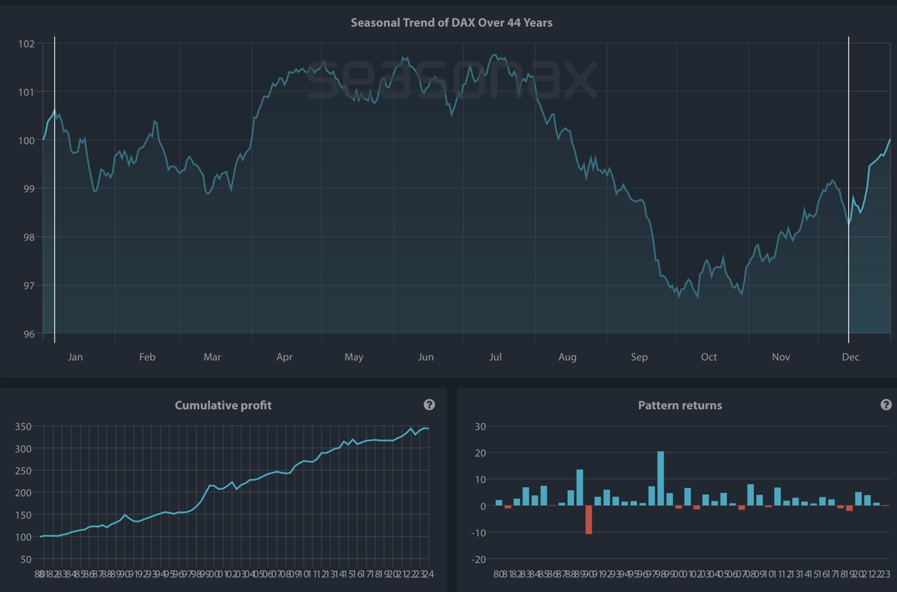
Source: Seasonax
There are a few explanations that have been offered for this seasonal phenomenon.
Window dressing by investment funds is an often cited reason for the end-of-year stock market rally. In other words, investment funds are supporting prices at the year-end in order to embellish their results, with the (purely coincidental but undoubtedly welcome) side-effect of boosting bonus payments, which are often calculated at the turn of the year.
However, although less obvious, psychological reasons are probably more often an important factor. These include the fact that most people tend to take stock at the end of the year and position themselves for the new year. In addition, there is the statistically significant holiday effect, which demonstrably tends to lead to stock market rallies ahead of other holidays as well.
This is a reason we can all relate to, as Christmas shopping and good spirits appear to be spilling over into the stock market as well.
Before entering into Christmas mode therefore make use of Seasonax to identify the best seasonal patterns.
With Seasonax, you will be able to scan for more than 25.000 instruments, including different sectors, stocks, (crypto)currencies, commodities, and indexes.
Wishing you all a bullish end to the year!
And remember don’t just trade it – Seasonax it!
—
Originally Posted December 11, 2024 – Will Markets End 2024 on a High Note?
Past results and past seasonal patterns are no indication of future performance, in particular, future market trends. Seasonax GmbH neither recommends nor approves of any particular financial instrument, group of securities, segment of industry, analysis interval or any particular idea, approach, strategy or attitude nor provides consulting nor brokerage nor asset management services. Seasonax GmbH hereby excludes any explicit or implied trading recommendation, in particular, any promise, implication or guarantee that profits are earned and losses excluded, provided, however, that in case of doubt, these terms shall be interpreted in abroad sense. Any information provided by Seasonax GmbH or on this website or any other kind of data media shall not be construed as any kind of guarantee, warranty or representation, in particular as set forth in a prospectus. Any user is solely responsible for the results or the trading strategy that is created, developed or applied. Indicators, trading strategies and functions provided by seasonax GmbH or on this website or any other kind of data media may contain logical or other errors leading to unexpected results, faulty trading signals and/or substantial losses. Seasonax GmbH neither warrants nor guarantees the accuracy, completeness, quality, adequacy or content of the information provided by it or on this website or any other kind of data media. Any user is obligated to comply with any applicable capital market rules of the applicable jurisdiction. All published content and images on this website or any other kind of data media are protected by copyright. Any duplication, processing, distribution or any form of utilisation beyond the scope of copyright law shall require the prior written consent of the author or authors in question. Futures and forex trading contains substantial risk and is not for every investor. An investor could potentially lose all or more than the initial investment. Risk capital is money that can be lost without jeopardizing ones’ financial security or lifestyle. Only risk capital should be used for trading and only those with sufficient risk capital should consider trading. Past performance is not necessarily indicative of future results. Testimonials appearing on this website may not be representative of other clients or customers and is not a guarantee of future performance or success.
Information posted on IBKR Campus that is provided by third-parties does NOT constitute a recommendation that you should contract for the services of that third party. Third-party participants who contribute to IBKR Campus are independent of Interactive Brokers and Interactive Brokers does not make any representations or warranties concerning the services offered, their past or future performance, or the accuracy of the information provided by the third party. Past performance is no guarantee of future results.
This material is from Seasonax and is being posted with its permission. The views expressed in this material are solely those of the author and/or Seasonax and Interactive Brokers is not endorsing or recommending any investment or trading discussed in the material. This material is not and should not be construed as an offer to buy or sell any security. It should not be construed as research or investment advice or a recommendation to buy, sell or hold any security or commodity. This material does not and is not intended to take into account the particular financial conditions, investment objectives or requirements of individual customers. Before acting on this material, you should consider whether it is suitable for your particular circumstances and, as necessary, seek professional advice.
Related Articles


Join The Conversation
For specific platform feedback and suggestions, please submit it directly to our team using these instructions.
If you have an account-specific question or concern, please reach out to Client Services.
We encourage you to look through our FAQs before posting. Your question may already be covered!