
- Solve real problems with our hands-on interface
- Progress from basic puts and calls to advanced strategies
Interactive Options Course

Posted March 6, 2025 at 1:03 pm
Yesterday’s stock market recovery was driven by the announcement of a one-month delay in implementing tariffs for US automobile manufacturers and this morning’s equity bounce off the lows was triggered by Secretary of Commerce Howard Lutnick disclosing that duties on nearly all products from Canada and Mexico will likely be postponed. While this shored up investor sentiment, it created increased confusion amongst traders. Indeed, a common question on Wall Street is if trade policy will be draconian. The administration is already feeling pressure to please its constituents, with February layoff announcements soaring to their highest level since July 2020, during the depths of COVID-19. And while tomorrow’s jobs report will provide more evidence of employment conditions, recent indicators have been disappointing, including ADP’s big miss this week amidst unemployment claims trending higher. Furthermore, rising evidence of consumer stress as reported in corporate earnings calls, sentiment surveys and hard figures from economic data prints, such as retail sales as well as personal income and outlays, is worrying the Executive Branch that its aggressive measures of fiscal austerity, trade policy and immigration may weigh on capital markets and the economy. In light of these concerns, our IBKR ForecastTrader prediction market has raised the probability of a second-quarter US technical recession to 26%
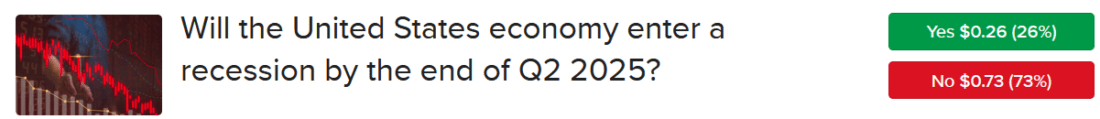
Source: ForecastEx
Layoffs surged last month to the highest level since July 2020, as austerity measures to reduce the federal government’s roster weighed on employment conditions. Outplacement firm Challenger, Gray & Christmas reported 172,017 dismissals in February, up 245% month over month (m/m). Discharges were led by the federal government, retail and technology sectors with figures totaling 62,242, 38,956 and 14,554, which collectively represented roughly two-thirds of the total and generated worries of labor market weakness spreading beyond the public sector.
A separate report on unemployment claims from the federal government depicted an ongoing deterioration in employment conditions, with both initial and continuing filings moving north again. But the last two weeks produced bifurcated performance in the short-term with initial claims declining to 221,000 for the week ended March 1, missing the median estimate of 235,000 and the previous period’s 242,000. The continuing segment, on the other hand, jumped north to 1.897 million for the seven-day interval completed on February 22, nearly the highest level in 39 months, which would’ve have been eclipsed at over 1.9 million. The number arrived as a surprise considering the projection was just 1.88 million and the prior report came in at 1.855 million. Four-week moving average trends ticked north on both fronts, from 224,000 and 1.863 million to 224,250 and 1.866 million.

Stocks are off their lows as Commerce Secretary Lutnick announces that more tariff alleviation is on the way. But the long end of the yield curve is moving north aggressively, as European differentials incentivize fixed-income positioning across the Atlantic. Rates have been jumping in the continent as the region’s largest economy agreed to amplify fiscal limits to enable an increase in defense spending. The proposals to strengthen the EU’s military might in light of a shifting world order and rising pressure to provide more support to Kyiv are driving up the cost of duration across world economies. Here in the US, the development is leading to a much weaker dollar amidst a heavier long end, with the Dollar Index down 31 basis points (bps) and the 2- and 10-year Treasury maturities changing hands at 4.00% and 4.33% in bear-steepening fashion, unchanged on the former but 5 bps taller on the latter. The greenback is depreciating relative to all of its major counterparts, including the euro, pound sterling, franc, yen, yuan, loonie and Aussie tender.
Domestic equity benchmarks have bounced strongly and are near their highs of the day as the S&P 500 Index succeeds in remaining above its 200-day moving average yet again. Still the major indices are all red at the moment with the Nasdaq 100, S&P 500, Russell 2000 and Dow Jones Industrial gauges losing 1.2%,0.9%, 0.6% and 0.3%. Sectoral breadth is deeply negative with just the materials segment gaining out of the 11 majors; it’s up 0.2%. Leading the laggards south are real estate, utilities and technology; those components are losing 2%, 1.6% and 1.3%. In commodities, price action is tilted to the downside with lumber, crude oil and gold lower by 0.7%, 0.6% and 0.1% but copper and silver are higher by 0.8% and 0.2%. Copper is continuing its run on yesterday’s news that the commodity may face 25% import tariffs, providing support to the materials equity sector.
As Wall Street awaits potential news from Washington regarding tariffs, folks are also gearing up for tomorrow’s Jobs Friday. I’m expecting a miss with the figure arriving at 115,000, which is below the implied expectation from the IBKR ForecastTrader prediction market of around 145,000 and the consensus projection of 160,000. I’m also out of the consensus with my unemployment rate and average hourly earnings estimates, which are at 4.1% and 0.4%, a tenth of a percent higher than Wall Street. Tomorrow will be a busy day and I will have a full slate, including reporting the results with the media, the Economic Club of New York and here on Traders’ Insight in the morning and afternoon. But tomorrow night, I’ll be at the X live studio at 7:00 p.m. covering the important details of the print, continuing our monthly routine, as well as answering your questions in real time. Finally, next week I’ll join Chief Strategist Steve Sosnick and Director of Trading Education Andrew Wilkinson for our monthly Jobs podcast, followed shortly by the Spanish version with Latin American Institutional Sales Director Judith Casasampere.


The European Central Bank (ECB) today cut its key rate 25 bps to 2.5%, an expected change that the organization believes is making monetary policy “meaningful less restrictive.” The action comes after the area’s latest inflation print arrived at 2.4% for February, a higher-than-anticipated reading but down from January. The ECB today also noted that disinflation is on track, although domestic price pressures are still high. The institution also stated that lending is becoming less expensive and loan growth is increasing.
In a related matter, retail sales in the euro area continued to languish during the first month of this year on both m/m and year-over-year (y/y) bases. Sales, which are adjusted for inflation, climbed only 1.5% y/y but sank 0.3% m/m, weakening from December’s 2% increase relative to the year-ago period and flat compared to November. The January results were also weaker than the analyst consensus forecasts for y/y and m/m prints of 1.9% and 0.1%. Relative to December, sales in the food, drinks, and tobacco category climbed 0.6% but failed to offset the 0.7% decline of the non-food products (except automotive fuel) group and the 0.3% drop of fuel transactions at specialized stores.
Demand for apartments in Australia drove a 6.3% m/m increase in building permits in January, up from the 1.7% gain in the preceding month, but the y/y gain of 9.1% eased slightly from December’s 10.1% growth, according to the Australian Bureau of Statistics. Both January metrics significantly surpassed analysts’ expectation for a 0.1% m/m decline and a y/y gain of 5.60%. The m\m result was driven by a 12.7% jump in private sector dwellings excluding houses while the private sector houses category climbed only 1.1%.
Inflation in South Korea eased last month from January’s pace with the Consumer Price Index arriving at 2% y/y and 0.3% m/m, a decline from 2.2% and 0.7%. January’s y/y result matched the analyst consensus expectation, but the m/m metric was slightly higher than the 0.2% forecast. On a y/y basis, transportation costs rose 2.2% followed by a 2.1% gain in education expenses and a 2% northward change in food and non-alcoholic beverages.
To learn more about ForecastEx, view our Traders’ Academy video here
New to Interactive Brokers?
Open AccountInformation posted on IBKR Campus that is provided by third-parties does NOT constitute a recommendation that you should contract for the services of that third party. Third-party participants who contribute to IBKR Campus are independent of Interactive Brokers and Interactive Brokers does not make any representations or warranties concerning the services offered, their past or future performance, or the accuracy of the information provided by the third party. Past performance is no guarantee of future results.
This material is from IBKR Macroeconomics, an affiliate of Interactive Brokers LLC, and is being posted with its permission. The views expressed in this material are solely those of the author and/or IBKR Macroeconomics and Interactive Brokers is not endorsing or recommending any investment or trading discussed in the material. This material is not and should not be construed as an offer to buy or sell any security. It should not be construed as research or investment advice or a recommendation to buy, sell or hold any security or commodity. This material does not and is not intended to take into account the particular financial conditions, investment objectives or requirements of individual customers. Before acting on this material, you should consider whether it is suitable for your particular circumstances and, as necessary, seek professional advice.
Interactive Brokers LLC is a CFTC-registered Futures Commission Merchant and a clearing member and affiliate of ForecastEx LLC (“ForecastEx”). ForecastEx is a CFTC-registered Designated Contract Market and Derivatives Clearing Organization. Interactive Brokers LLC provides access to ForecastEx Forecast Contracts for eligible customers. Interactive Brokers LLC does not make recommendations with respect to any products available on its platform, including those offered by ForecastEx.
This is commentary on economic, political and/or market conditions within the meaning of CFTC Regulation 1.71, and is not meant provide sufficient information upon which to base a decision to enter into a derivatives transaction.
Related Articles


Join The Conversation
For specific platform feedback and suggestions, please submit it directly to our team using these instructions.
If you have an account-specific question or concern, please reach out to Client Services.
We encourage you to look through our FAQs before posting. Your question may already be covered!