
- Solve real problems with our hands-on interface
- Progress from basic puts and calls to advanced strategies
Interactive Options Course

Posted July 16, 2026 at 11:15 am
Although economic conditions did not change much between the first and second quarters, investors were far more bullish in the second quarter.
Risk assets performed exceptionally well in the second quarter. The S&P 500 rallied an eye-popping 15% during the period, which was its best return since the second quarter of 2020. Similarly, high yield bonds had a strong quarter as robust corporate earnings helped on both sides of the balance sheet. U.S. Treasury returns notably lagged, as Fed watchers flipped from hoping for rate cuts to fearing rate hikes. The returns during the second quarter were a stark reversal from the first quarter, which saw the S&P 500 decline by over 4% and fixed income return roughly zero, particularly considering that economic fundamentals were relatively similar during the two periods. In our view, the best explanation for the turnaround is that investors’ perception of the risks shifted – essentially, the glass was half empty in the first quarter but half full in the second.
In our previous outlook, Everything Everywhere All at Once, we outlined the seemingly unending list of challenges that caused markets to struggle during the first quarter, including evolving tariff policies, a DOJ investigation into the Fed Chair, AI breakthroughs that triggered a massive software selloff, a partial government shutdown, and the war in Iran as well as other geopolitical tensions. In the second quarter, investors seemed to ignore most of those concerns (and the government shutdown ended), focusing instead on two issues – the war in Iran, which they concluded was less impactful than initially feared, and the massive amounts of AI-related CapEx undertaken by the hyperscalers, which was deemed a tailwind rather than a headwind.
Looking first at the implications of the war, oil closed at $65 per barrel on the last trading session before the U.S. and Israel launched large-scale strikes on Iranian targets. Oil quickly spiked to $113 by April 7th, as the market was rightly concerned about potentially losing 20% of the world’s oil exports in addition to a meaningful supply of other commodities, including fertilizer. This type of supply shock and price spike has led to recessions in the past and ranks high as a market risk factor, so why were investors unfazed?
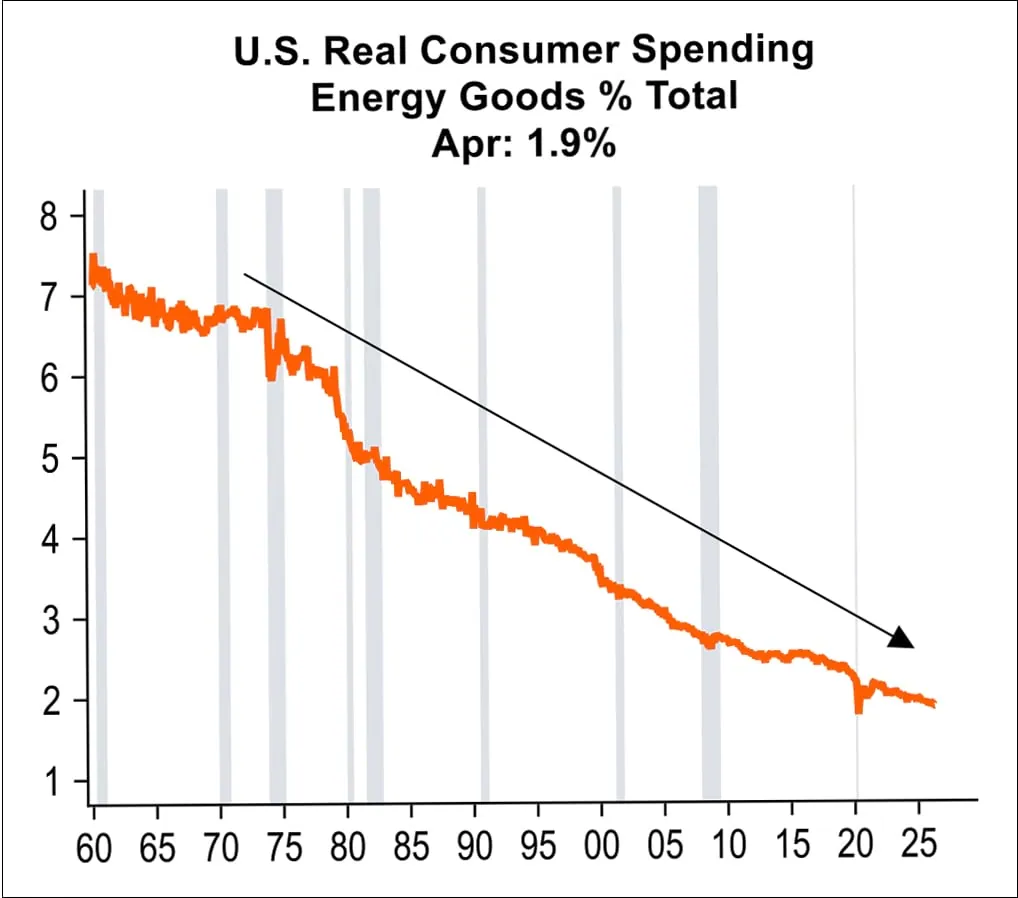
From the consumer’s perspective, the price of gas is one of the few assets that does not psychologically adjust with inflation. It has marginally outpaced inflation over the last 30 years, while other expenses like healthcare and higher education are significantly higher. As a result, the percentage of consumer spending on energy is roughly half of its peak in the 1980s. While the daily media barrage might impact their psyche, energy does not have the same impact on consumers’ wallets as we have grown up believing. We feel this is the main reason markets were able to shrug off the oil shock, combined with the fact that most observers felt the price spike would normalize fairly quickly once hostilities ended.
The other big storyline in the second quarter, which may have even been more impactful than the war, was the ongoing investment in AI by the hyperscalers (e.g., Microsoft, Alphabet, Amazon, Oracle, and Meta). Although some of those individual companies saw their share prices decline during the period, broadly speaking markets treated the AI investment cycle as a tailwind, particularly for hardware, software, and infrastructure companies that directly benefit from the data center buildout.
We appreciate this perspective, as the capital investment in AI infrastructure is the largest that we have seen in thirty years, but we think the exuberance of the second quarter oversimplifies the situation. Even though the current investment level as a percentage of GDP is comparable to other transformational investment cycles, such as the telecom buildout in the 1990s, that cycle resulted in excess capacity and over-investment, which serves as a reminder of the risk of AI repeating the same mistake. Moreover, we are still in the early stages of this buildout, so the ultimate AI spend may eventually surpass all others.
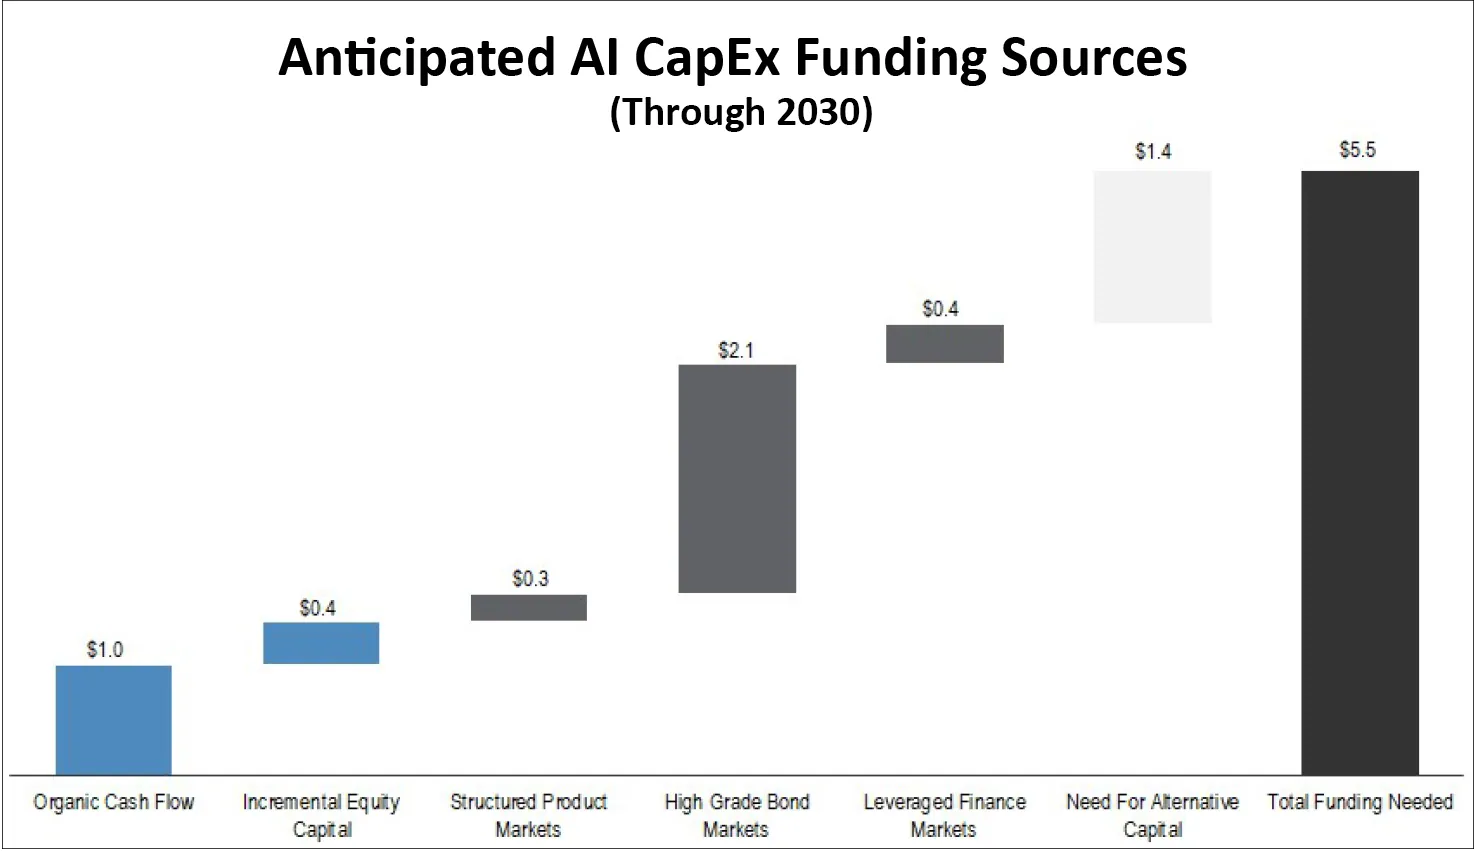
Even if the current buildout does not result in excess capacity, the sheer scale of the CapEx investment is transforming the capital markets, which we believe could become problematic in the future. AI/data center-related issuance has exceeded $300 billion this year. The issuers have tapped virtually every corner of the capital markets, with the largest portion of the funding coming from the investment grade debt market. This is to be expected given the strength of the hyperscalers’ balance sheets but much of the issuance has been structured to remain at arm’s length from the ultimate issuer. If business/profits do not develop it will be interesting to see how these special purpose vehicles perform for investors. In the equity market, SpaceX raised $75 billion in the largest IPO ever (later upsized to ~$86 billion), and Alphabet, the parent of Google, raised $80 billion in an equity and equity-linked offering. It is notable – and worth watching – that the hyperscalers have gone from significant buyers of their own stock (via share buybacks) to sellers of their stock (via secondary offerings).
Looking forward, J.P. Morgan estimates that total AI CapEx spending could reach $5.5 trillion by 2030. If this plays out as expected, there will be a steady supply in all capital markets. They expect approximately $2.8 trillion to be issued across the public and private debt markets, including investment grade, leveraged finance (e.g., high yield and leveraged loans), and structured products. This still leaves $1.4 trillion of additional need for alternative capital to finance. To put that into perspective, that amount is approximately the size of the entire high yield market today!
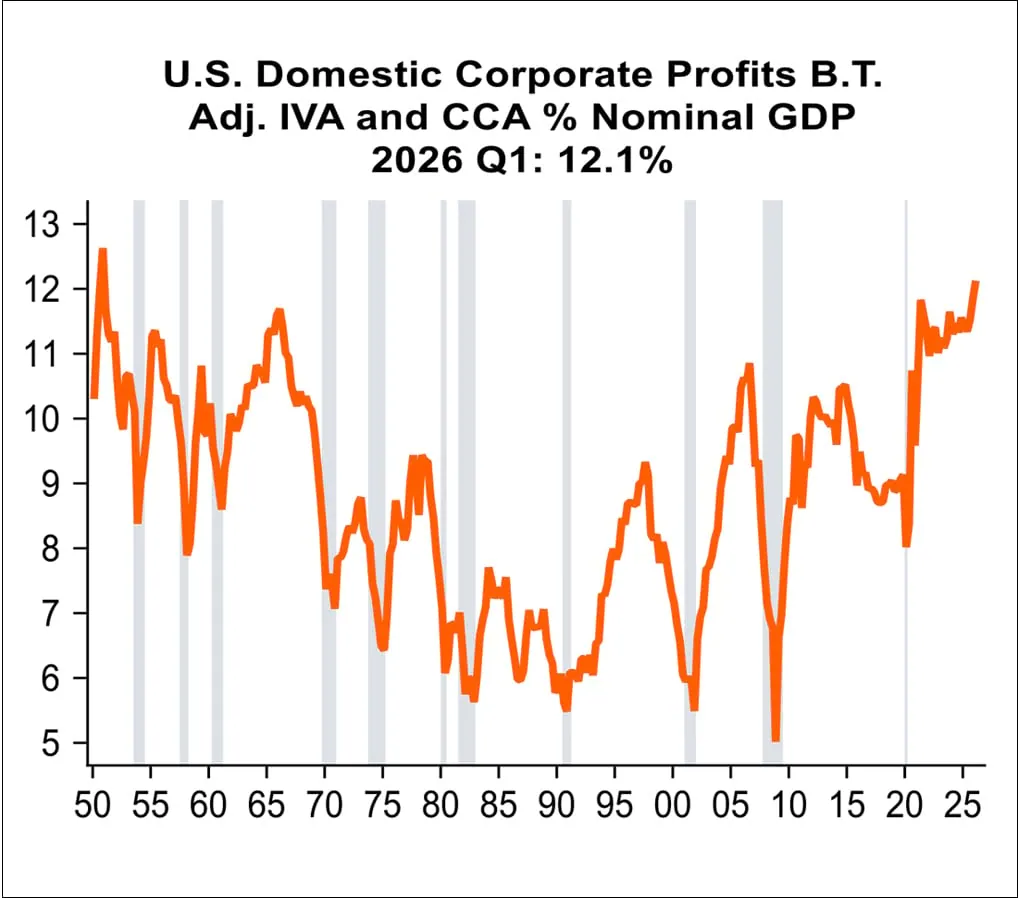
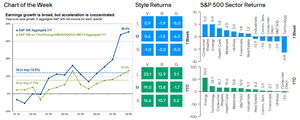
For now, the ongoing wave of hyperscaler CapEx has lifted profits, and U.S. corporations are doing exceptionally well. The tax cuts in the 2025 Budget Act have certainly helped their bottom line, and they have been able to navigate and/or pass along the tariffs to consumers. This has led to year-over-year S&P 500 earnings growth of 27%, and corporate profits are growing significantly faster than the economy. As the chart below shows, corporate profits as a percentage of GDP are at the highest level in the past 40 years and have risen significantly since the COVID-induced slowdown. From this perspective, risk markets appear to be appropriately responding to earnings growth, and the strong performance in the second quarter is reasonable. This is not to say the problems with excessive debt are behind us, but rather they will ebb and flow from month to month.
Looking forward, we are optimistic that the high yield market will continue to be the sweet spot in fixed income. The quality of the index has steadily improved, as nearly 60% is now BB rated, versus ~40% in 2007, while the CCC component is now ~9% vs ~18% in 2007. This means that credit risk metrics are as good as they have ever been. However, we remain cautious that markets may not float on optimism in perpetuity, and we are carefully monitoring multiple risk factors. First, the secondary effects of the war in Iran and subsequent closing of the Strait of Hormuz have not yet been fully realized. One area in particular is the supply of fertilizer, which is not as easy to replace as oil. This certainly has the potential to lead to further food inflation, which could keep inflation higher for longer. Similar to gas prices, food prices are viewed by consumers as a proxy for overall inflation, and this can lead to a deterioration in consumer confidence.
Moreover, U.S. Treasury supply continues to increase in order to fund growing deficits, which will keep upward pressure on rates. The new Fed Chair Kevin Warsh has already been on record expressing concerns around price stability, so he may adopt a more restrictive policy or potentially tighten the balance sheet. As discussed above, the investment grade market is expected to see substantial supply from AI-related issuance, which could replace banks as the largest sector in the Bloomberg U.S. Aggregate Index.
Likewise, we would be remiss not to touch upon private credit. The number of private credit funds that announce redemption requests in excess of their quarterly gates continues to rise, and the past quarter was no exception. We remain bearish on the asset class, and we anticipate defaults and write downs will increase materially at some point. Medallia is a recent example where the sponsor wrote off nearly $5 billion in equity, and private funds who owned the debt were also hurt.
All of these concerns lead us to reinforce our cautious portfolio positioning. We will continue to avoid areas of the market where we do not observe favorable risk/return relationships, and we will focus on companies with strong balance sheets run by responsible management teams.
As always, we thank you for your confidence in our management and we look forward to hearing from you.
—
Originally Posted July 15, 2026 – Q3 Strategic Income Outlook: Perception Is Reality
Information posted on IBKR Campus that is provided by third-parties does NOT constitute a recommendation that you should contract for the services of that third party. Third-party participants who contribute to IBKR Campus are independent of Interactive Brokers and Interactive Brokers does not make any representations or warranties concerning the services offered, their past or future performance, or the accuracy of the information provided by the third party. Past performance is no guarantee of future results.
This material is from Osterweis Capital Management and is being posted with its permission. The views expressed in this material are solely those of the author and/or Osterweis Capital Management and Interactive Brokers is not endorsing or recommending any investment or trading discussed in the material. This material is not and should not be construed as an offer to buy or sell any security. It should not be construed as research or investment advice or a recommendation to buy, sell or hold any security or commodity. This material does not and is not intended to take into account the particular financial conditions, investment objectives or requirements of individual customers. Before acting on this material, you should consider whether it is suitable for your particular circumstances and, as necessary, seek professional advice.
Related Articles



















Join The Conversation
For specific platform feedback and suggestions, please submit it directly to our team using these instructions.
If you have an account-specific question or concern, please reach out to Client Services.
We encourage you to look through our FAQs before posting. Your question may already be covered!