Risk-off trading is dominating Wall Street as yesterday’s hawkish dot plot alongside Fed Chief Powell’s reluctance to cut rates weighs on sentiment. While yesterday’s rally was motivated by the doughnut CPI, this morning’s news of wholesale deflation amidst the loftiest level of weekly layoffs since August is concerning market participants about softening earnings prospects and sparking modest volatility. Stocks initially jumped on slower-than-expected economic figures, but most have reversed into the red, while technology fights desperately to hang on.
Powell Dashes Hopes for July
Powell brought the ants to the picnic of rate cut optimism yesterday when he emphasized that the central bank still needs more evidence of sustainably declining inflation before it begins to accommodate. In his presentation, he frequently said increased confidence in disinflation is required, and he expressed sensitivity to the potential for restrictive policy to trigger a significant economic slowdown, but he said the Fed is seeking to avoid such a scenario rather than break the economy and then try to fix it. He spoke shortly after the release of the May Consumer Price Index (CPI) showed no increase in the gauge’s headline number, a development that rallied optimism for the central bank to lower rates. While committee members had an opportunity to revise their projections of year-end fed funds following May’s CPI, the dots fell short of market expectations, penciling in just one reduction in 2024.
Energy Prices Drive Wholesale Deflation
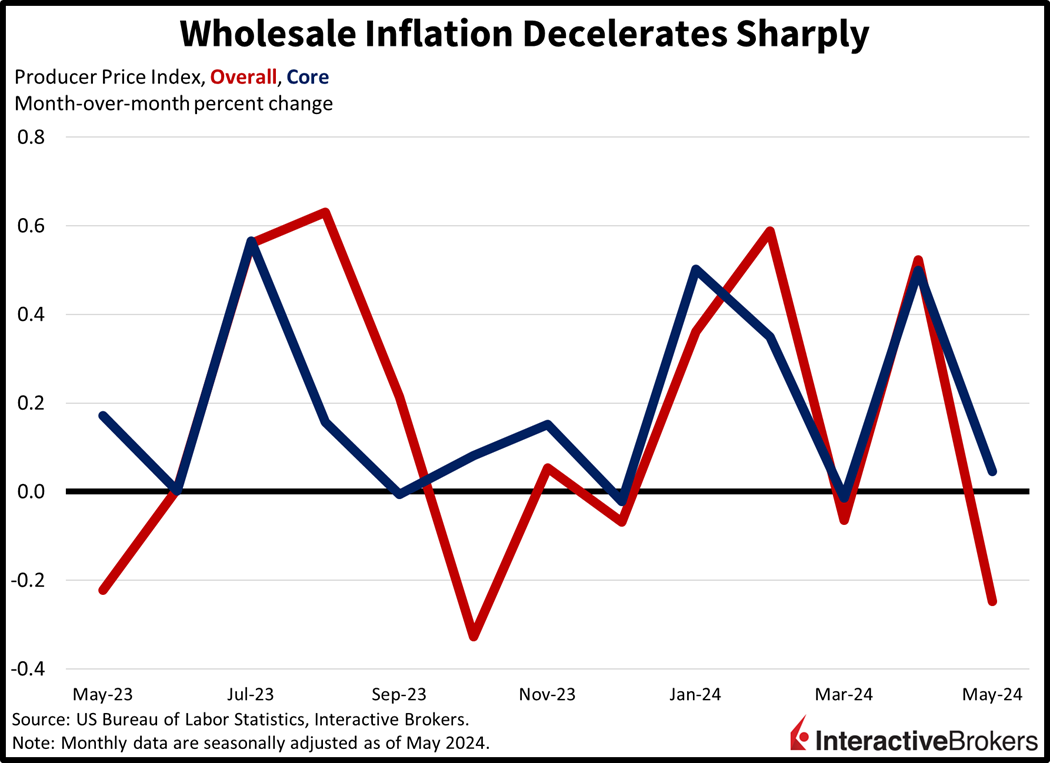
Relief from pain inflicted by energy invoices contributed to the Producer Price Index (PPI) declining 0.2% in May on a month-over-month (m/m) basis, a big improvement from the 0.5% jump in April and the analyst expectation for a 0.1% increase. Within the index, overall cost of goods dropped 0.8%, primarily from gasoline, diesel fuel, jet fuel and commercial electric power becoming easier on the wallet, causing the overall energy component to fall 4.8%, its biggest decrease since October. Food charges also fell 0.1%. It was only the second time that the headline moved south this year and the largest drop since October 2023, when the gauge fell 0.3%. In another encouraging sign, the inflation-sticky services component was flat m/m, largely a result of fuel expenses helping the transportation and warehousing component to drop 1.4%, which offset 0.2% and 0.1% increases for the trade group and other category. Excluding food, energy and trade, the PPI was flat m/m and like the headline number was 30 basis points (bps) lower than the analyst consensus expectation. On a year-over-year (y/y) basis, the headline print climbed 2.2% while the PPI excluding food, energy and trade climbed 3.2%.

Labor Market Softens with Spike in Layoffs
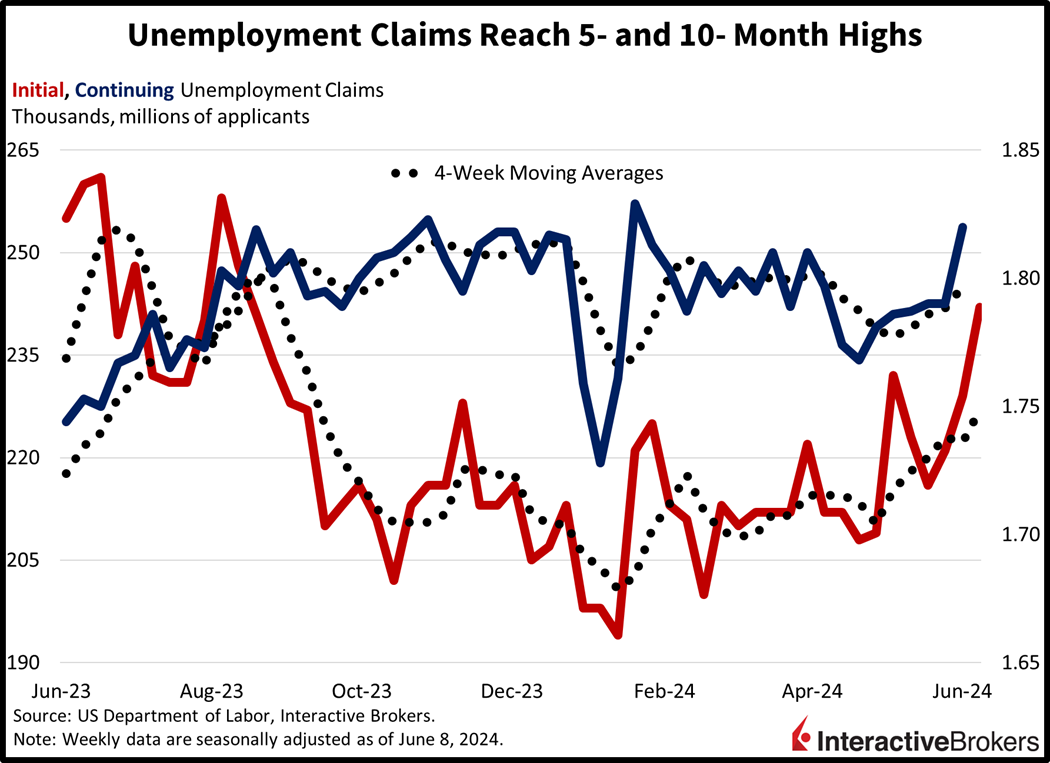
Layoffs rose to their tallest level in quite some time, with initial and continuing claims reaching ten- and five-month highs. Initial claims for the week ended June 8 climbed to 242,000, up by 13,000 and well above the 225,000 expected by analysts. Meanwhile, continuing claims, which illustrate the ability for laid-off workers to find new jobs, climbed to 1.82 million for the week ended June 1, up 30,000 from the preceding period. In a signal of waning labor market momentum, four-week moving averages moved north from 222,250 and 1.788 million to 227,000 and 1.797 million for initial and continuing claims. While these developments are unfavorable for individuals who no longer have to punch a time clock, it points to easing conditions for employers and the potential for subdued price pressures as a result.

Stocks Lose Favor with Investors
Investors are unloading stocks and picking up Treasurys as yesterday’s Summary of Economic Projections pointed to just one rate cut by year-end. Considering sky-high valuations, there appears to be little reason to dive in and buy right here right now as a slowing economy is coinciding with a Fed that appears disciplined in reaching its 2% price pressure objective. But there’s always motivation to buy AI, however, as the Nasdaq Composite Index and the tech sector are the only gainers on a US index and sector basis; they’re up 0.1% and 0.5%. Meanwhile, the Russell 2000 and Dow Jones Industrial benchmarks are getting clobbered with values dropping 1.1% and 0.7%. The S&P 500 is doing a bit better and down just 0.2% because it has a larger tech concentration. Ten out of eleven sectors are red on the session with industrials, energy and materials leading the charge lower by losing 1.4%, 1% and 0.8%. In fixed-income land, Treasurys are catching a bid as market players look to lock in the yields of the day in case there’s a downturn around the corner. The 2- and 10-year maturities are changing hands at 4.71% and 4.28%, 5 and 4 bps lighter on the session. Reduced borrowing costs are not derailing the dollar though, which is gaining strongly as the Fed’s monetary policy position is increasingly hard-nosed relative to global counterparts. Indeed, the greenback’s index is up 35 bps as the US currency gains relative to all of its major contemporaries including the euro, pound sterling, franc, yen, yuan and Aussie and Canadian dollars. Commodity land is weakening on the back of a firmer dollar and a hawkish Fed, with silver, copper, gold, lumber and crude oil all lower by 2%, 1.4%, 0.6%, 0.4% and 0.1%.
Stretched Valuations in Focus
With the Fed striving to avoid a resurgence in price pressures amidst slowing economic conditions, investors are asking themselves what the appropriate earnings multiple for equities is. While technology dreams and growth prospects can escape traditional valuation parameters for the time-being, most of the market can’t. Indeed, equity benchmarks with tech-heavy concentrations like the Nasdaq and the S&P 500 are sporting robust year-to-date performances of 19% and 14%, but the Dow Jones and Russell 2000 baskets, which are more diversified from a sector perspective, are only higher by 2% and 1%. At some point, the rubber will meet the road considering the long and variable lags of restrictive monetary policy and how they impact corporate earnings and economic performance.
Visit Traders’ Academy to Learn More About the Producer Price Index and Other Economic Indicators
Disclosure: Interactive Brokers Affiliate
Information posted on IBKR Campus that is provided by third-parties does NOT constitute a recommendation that you should contract for the services of that third party. Third-party participants who contribute to IBKR Campus are independent of Interactive Brokers and Interactive Brokers does not make any representations or warranties concerning the services offered, their past or future performance, or the accuracy of the information provided by the third party. Past performance is no guarantee of future results.
This material is from IBKR Macroeconomics, an affiliate of Interactive Brokers LLC, and is being posted with its permission. The views expressed in this material are solely those of the author and/or IBKR Macroeconomics and Interactive Brokers is not endorsing or recommending any investment or trading discussed in the material. This material is not and should not be construed as an offer to buy or sell any security. It should not be construed as research or investment advice or a recommendation to buy, sell or hold any security or commodity. This material does not and is not intended to take into account the particular financial conditions, investment objectives or requirements of individual customers. Before acting on this material, you should consider whether it is suitable for your particular circumstances and, as necessary, seek professional advice.


Join The Conversation
For specific platform feedback and suggestions, please submit it directly to our team using these instructions.
If you have an account-specific question or concern, please reach out to Client Services.
We encourage you to look through our FAQs before posting. Your question may already be covered!