
- Solve real problems with our hands-on interface
- Progress from basic puts and calls to advanced strategies
Interactive Options Course

Posted March 24, 2025 at 9:45 am
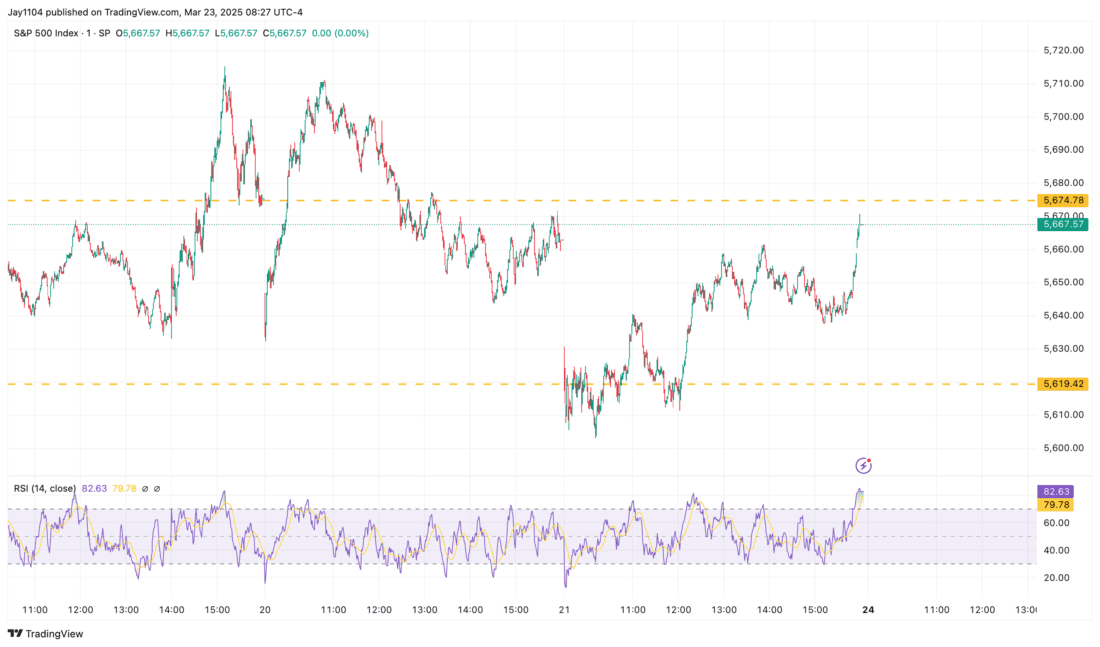
Friday was an interesting day — and not unexpected, given it was quarterly OPEX. The session wasn’t as strong as it may have seemed, considering the sharp drop at the open, followed by a steady rally throughout the day, capped off by a strong finish in the final 10 minutes. That end-of-day spike was driven by a market-on-close buy imbalance of nearly $4 billion on the SPX, which isn’t unusual on OPEX days.
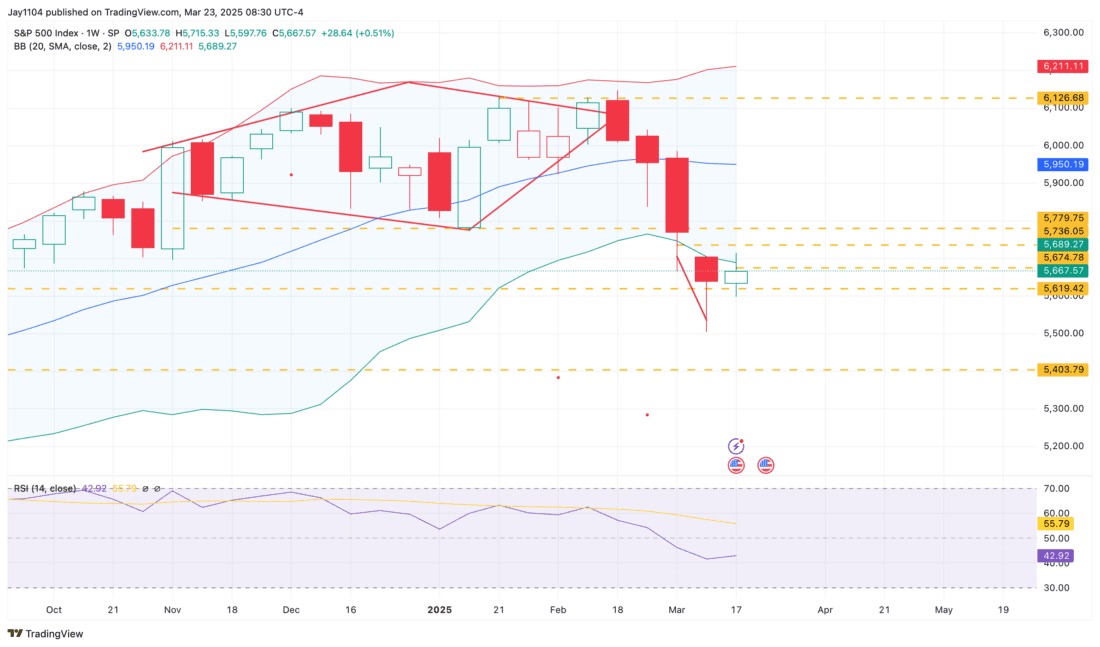
Another noteworthy development was that the S&P 500 avoided a fifth straight week of losses. I noted last week how rare such a streak is, and the index was due for a bounce on that factor alone. However, the index was unable to reclaim its lower Bollinger Band — a clear sign of how weak the rally attempt was.
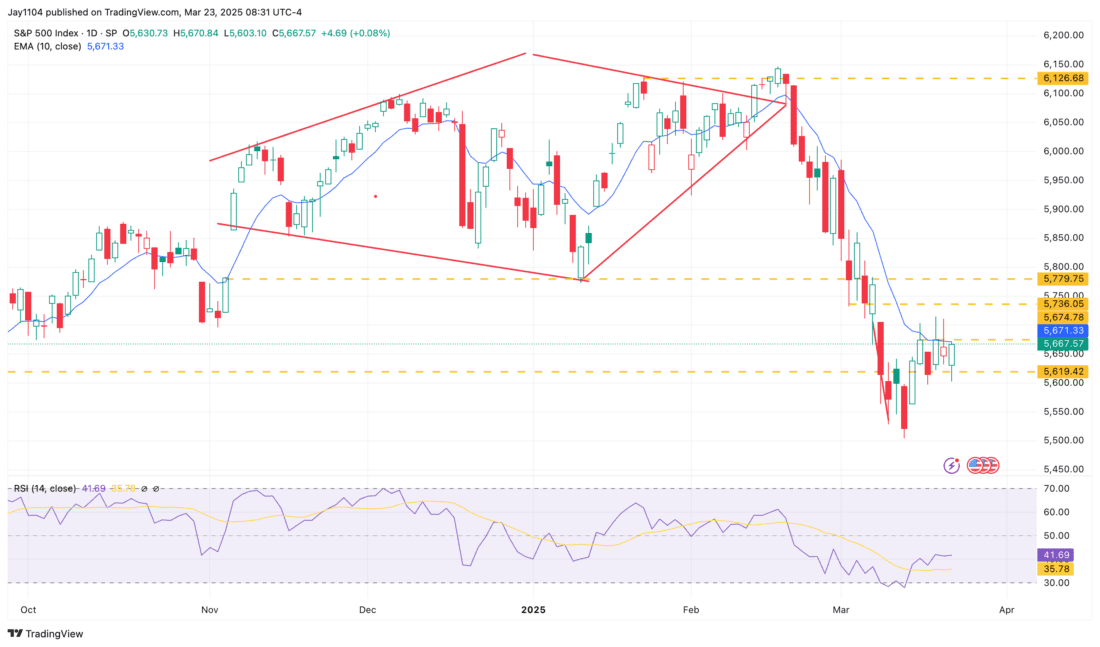
The 10-day exponential moving average continues to act as resistance, just as it has since the downtrend began. When you take these basic technical factors into account, it suggests to me that the move lower may not be finished — at least not until we see the index close above that exponential moving average for at least two consecutive days.
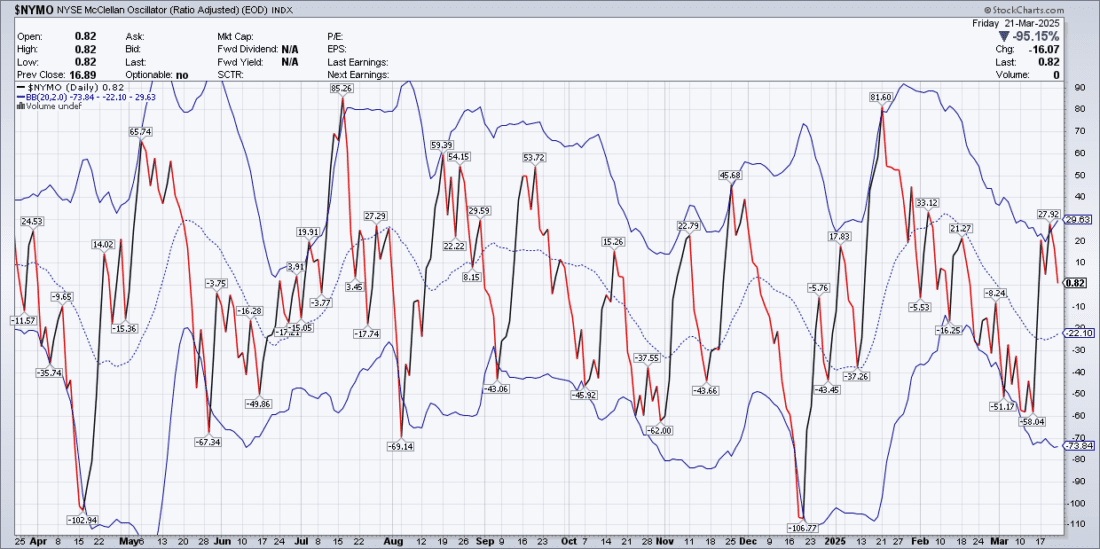
Additionally, breadth on Friday was weak, with 796 more decliners than advancers — pushing the NYSE McClellan Oscillator (NYMO) back to the zero line. NYMO also moved above its upper Bollinger Band on Wednesday, then crossed below it on Thursday and continued lower on Friday — typically a short-term sell signal.
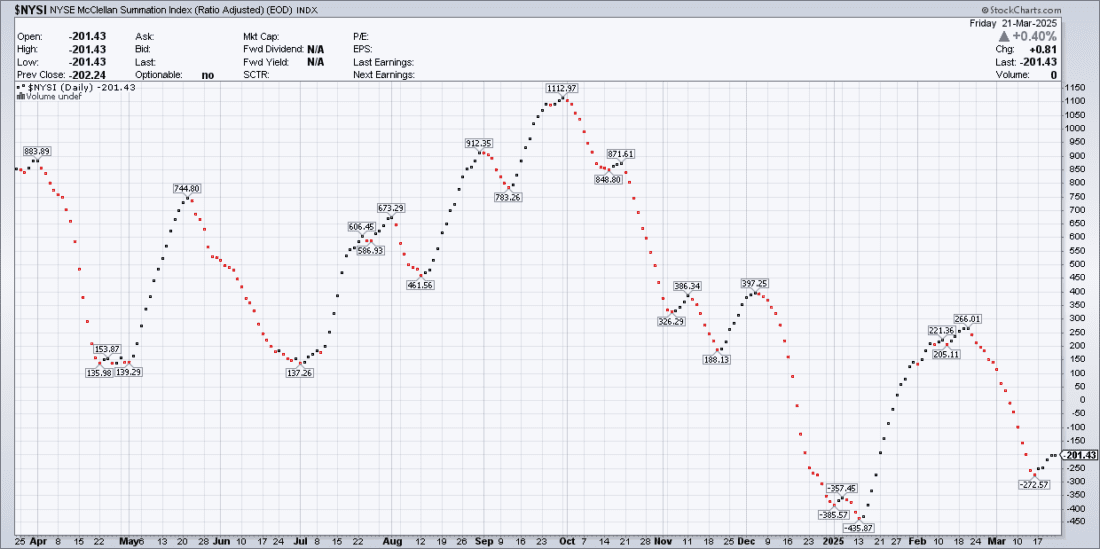
The Summation Index also shows that this recent rally lacked the velocity to indicate anything more than a pause in a broader downtrend.
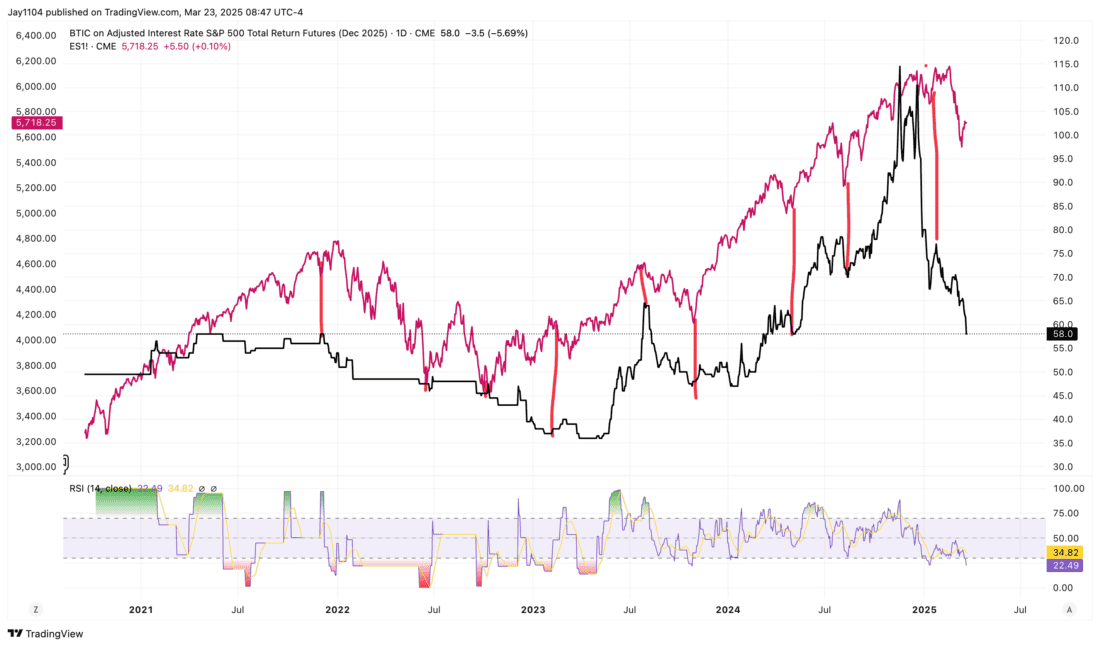
On the funding side, equity financing costs continue to fall. The BTIC S&P 500 Total Return Futures for December 2025 dropped to 58 basis points on Friday — its lowest level since May. It’s not a perfect indicator (nothing is), but it’s pretty good at identifying peaks, troughs, and turning points — just as it did back in December. The further it falls, the more likely it is that the declines in the index aren’t over.
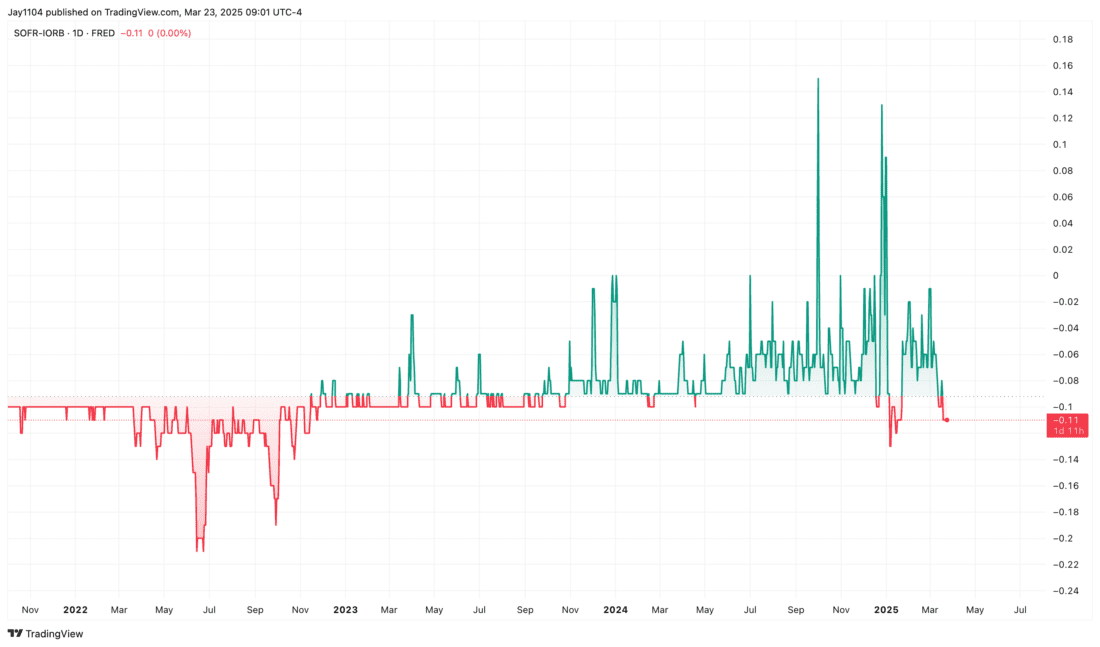
We’ve also recently seen the Secured Overnight Financing Rate (SOFR) fall 11 basis points below the Interest on Reserve Balances (IORB) rate. That’s a significant drop, suggesting the overnight funding market is flush with cash and that demand for borrowing is limited — similar to what we saw throughout much of 2022.
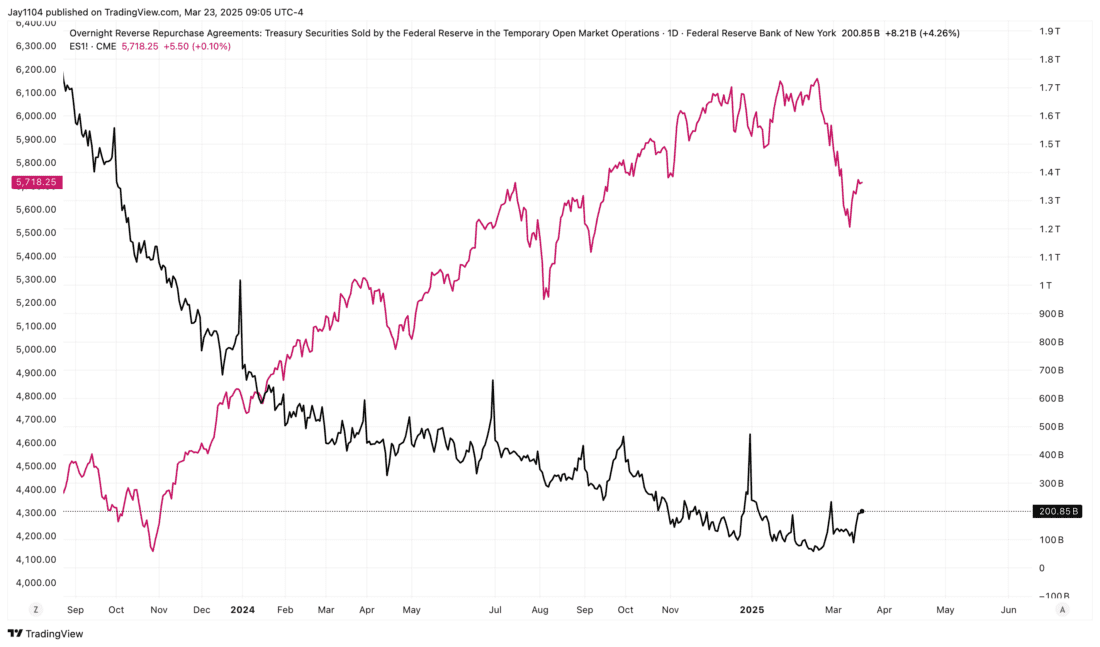
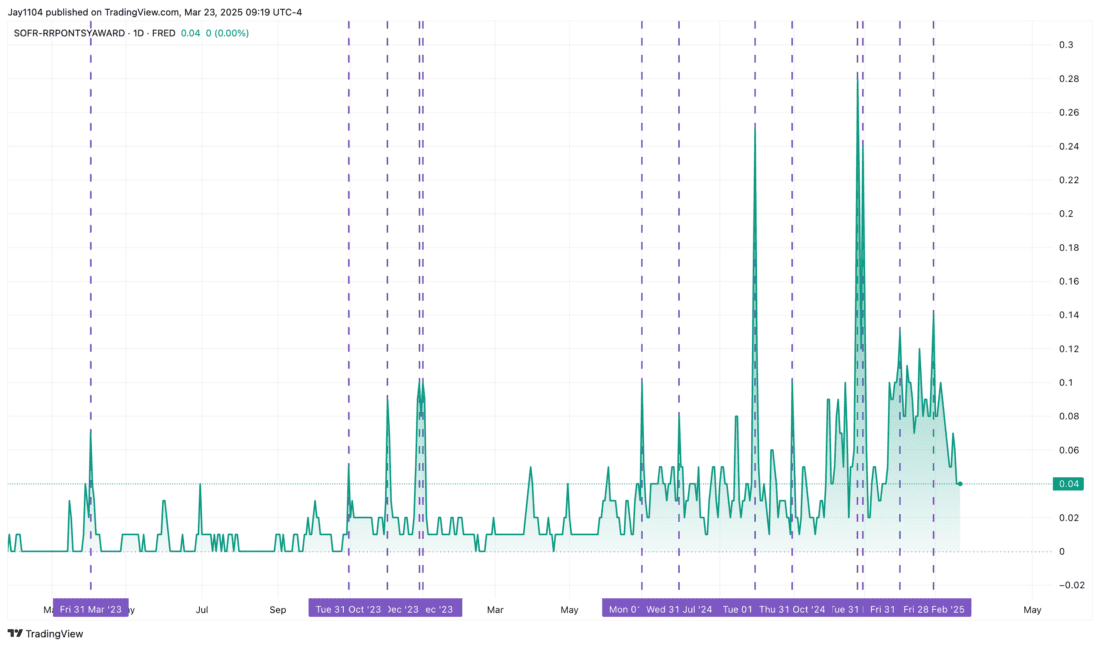
At the same time, usage of the Fed’s reverse repo facility has started to rise again. In fact, SOFR relative to the RRP rate has been falling, which suggests investors — particularly money market funds — are increasingly choosing to park cash with the Fed rather than lend it in the repo market.

This, combined with the drop in SOFR relative to both IORB and the reverse repo rate, suggests that risk is being pulled out of equities and redirected into safer, more liquid assets.
Some of this could be tied to quarter-end, but to be honest, we don’t usually see this behavior begin so early. In fact, SOFR rates typically rise into quarter-end as liquidity tightens — not fall.
All of this really speaks to me of leverage and margin being yanked out of the market. And it’s not likely to improve in the days ahead — it may actually get a bit worse, especially if the reverse repo facility usage continues to climb into March 31.
We’ll see what happens between now and then. But stay alert to the “plumbing” of the market — it matters, especially in a highly levered environment.
—
Originally Posted March 23, 2025 – Liquidity and Leverage Conditions Are Flashing Warning Signs for Markets
Terms by ChatGPT
OPEX (Options Expiration)
Definition: The day when stock or index options expire. Quarterly OPEX (March, June, Sept, Dec) often brings heightened volatility due to position unwinding and rebalancing.
Market-on-Close (MOC) Buy Imbalance
Definition: A trading imbalance at the close, where more buy orders than sell orders are submitted to execute at the closing price — often results in a late-day rally.
Bollinger Bands
Definition: A volatility-based technical indicator with upper and lower bands around a moving average. Price hugging the lower band or failing to re-enter the band suggests weakness.
10-Day Exponential Moving Average (EMA)
Definition: A moving average that gives more weight to recent prices. Commonly used to assess short-term trend direction or dynamic resistance/support.
Breadth
Definition: The number of advancing stocks minus declining stocks. Weak breadth means fewer stocks are participating in a rally or decline — often a warning sign.
McClellan Oscillator (NYMO)
Definition: A momentum indicator based on NYSE advancers and decliners. Moving outside and then back inside its Bollinger Bands often triggers short-term signals.
Summation Index
Definition: A longer-term momentum measure derived from the McClellan Oscillator. If it fails to rise during a rally, it suggests weak underlying participation.
BTIC (Basis Trade at Index Close)
Definition: A futures trade that lets investors transact at the anticipated cash close. Falling BTIC rates imply weaker demand for equity exposure or rising financing concerns.
SOFR (Secured Overnight Financing Rate)
Definition: The cost of borrowing cash overnight using Treasuries as collateral. A falling SOFR signals excess cash or low borrowing demand.
IORB (Interest on Reserve Balances)
Definition: The interest the Federal Reserve pays banks for holding excess reserves. It acts as a soft ceiling for short-term rates.
RRP (Reverse Repo Facility)
Definition: A Fed tool where institutions park cash overnight in exchange for Treasuries. Increased usage reflects risk-off behavior and tighter liquidity in markets.
Mott Capital Management is the portfolio manager for one portfolio offered by Interactive Advisors. Interactive Advisors clients do not invest directly with the Portfolio Managers like Mott Capital Management, and the Managers do not have discretionary trading authority over Interactive Advisors client accounts. The Portfolio Managers on the Interactive Advisors platform simply license their trade data to Interactive Advisors, which then allows its clients to have the same strategy and trading decisions mirrored in their accounts if the Portfolio is in line with their risk score. Portfolio Managers like Mott Capital Management implement their trading philosophy and strategy without knowing the identity of Interactive Advisors’ clients or taking into account these clients’ individualized circumstances.
Mott Capital Management has entered into a Portfolio Manager License Agreement with Interactive Advisors pursuant to which it provides trading data IA uses to offer a portfolio to its investment advisory clients. Mott Capital Management is not affiliated with any entities in the Interactive Brokers Group.
Interactive Advisors is an affiliate of Interactive Brokers LLC.
Pursuant to the Investment Management Agreement between Interactive Advisors and its clients, all brokerage transactions occur through Interactive Brokers LLC, an affiliate of Interactive Advisors. The use of an affiliate for brokerage services represents a potential conflict of interest as Interactive Brokers LLC is paid a commission on trades executed on behalf of Interactive Advisors. Interactive Brokers LLC does not consider this conflict material as it does not sell, solicit, recommend, trade against or otherwise attempt to induce Interactive Advisors to place any orders in any products. Interactive Advisors does not offer services through any other broker-dealer. All trading by Interactive Advisors is self-directed. Interactive Advisors clients acknowledge this potential conflict of interest and authorize Interactive Advisors to execute transactions through Interactive Brokers LLC when they open an Interactive Advisors account. Clients should consider the commissions and other expenses, execution, clearance, and settlement capabilities of Interactive Brokers LLC as a factor in their decision to invest in an Interactive Advisors Portfolio. Interactive Advisors believes it satisfies its best execution obligation by trading its clients’ trades through Interactive Brokers LLC. While there can be no assurance that it will in fact achieve best execution, Interactive Advisors does periodically monitor the execution quality of transactions to ensure that clients receive the best overall trade execution pursuant to regulatory requirements.
Information posted on IBKR Campus that is provided by third-parties does NOT constitute a recommendation that you should contract for the services of that third party. Third-party participants who contribute to IBKR Campus are independent of Interactive Brokers and Interactive Brokers does not make any representations or warranties concerning the services offered, their past or future performance, or the accuracy of the information provided by the third party. Past performance is no guarantee of future results.
This material is from Mott Capital Management and is being posted with its permission. The views expressed in this material are solely those of the author and/or Mott Capital Management and Interactive Brokers is not endorsing or recommending any investment or trading discussed in the material. This material is not and should not be construed as an offer to buy or sell any security. It should not be construed as research or investment advice or a recommendation to buy, sell or hold any security or commodity. This material does not and is not intended to take into account the particular financial conditions, investment objectives or requirements of individual customers. Before acting on this material, you should consider whether it is suitable for your particular circumstances and, as necessary, seek professional advice.
Futures are not suitable for all investors. The amount you may lose may be greater than your initial investment. Before trading futures, please read the CFTC Risk Disclosure. A copy and additional information are available at ibkr.com.
Related Articles


Join The Conversation
For specific platform feedback and suggestions, please submit it directly to our team using these instructions.
If you have an account-specific question or concern, please reach out to Client Services.
We encourage you to look through our FAQs before posting. Your question may already be covered!