By Ryan Gorman, CFA, CMT, BFA
1/ A Weekly Look at the S&P 500
2/ The Same 500 Stocks, but an Equal Vote
3/ A Look Below the Surface
4/ CEG Still in an Uptrend
5/ GE Looking to Plot its Next Course
Investopedia is partnering with CMT Association on this newsletter. The contents of this newsletter are for informational and educational purposes only, however, and do not constitute investing advice. The guest authors, which may sell research to investors, and may trade or hold positions in securities mentioned herein do not represent the views of CMT Association or Investopedia. Please consult a financial advisor for investment recommendations and services.
1/
A Weekly Look at the S&P 500
It is a new week, and I am happy to back with you looking at some charts. Last week was a solid week for the major indices, though volume was light on the holiday shortened week.
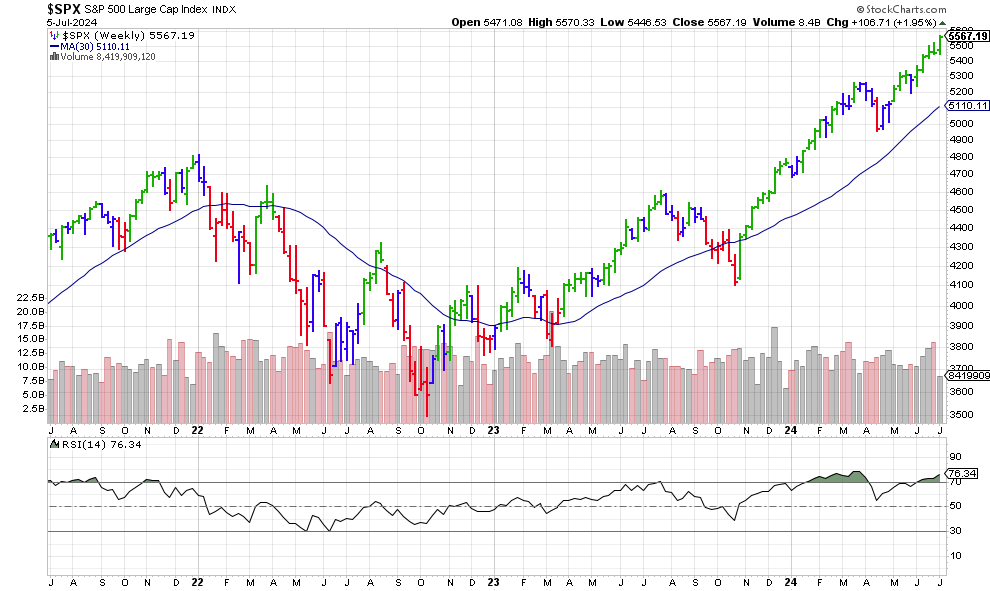
The market cap weighted S&P 500 has had a great year so far. The chart below shows a well-respected channel since the bull move began in fall 2022. The 30-week moving average is up and the price is firmly above it. The elder bars are still green, but the top of the channel is now being hit. Seasonally, July is the best month of the third quarter, but returns are front loaded in the beginning of the month.
Courtesy of StockCharts.com
We must respect the trend, and this is not a call for a top. There could be a throw over acceleration of the trend. Price could even ride the upper trendline. It is worth noting the distance from the 30-week moving average and the upper trendline could provide a “logical” place to digest some gains.
More about the Elder impulse system here: Elder Impulse System | ChartSchool | StockCharts.com
2/
The Same 500 Stocks, but an Equal Vote
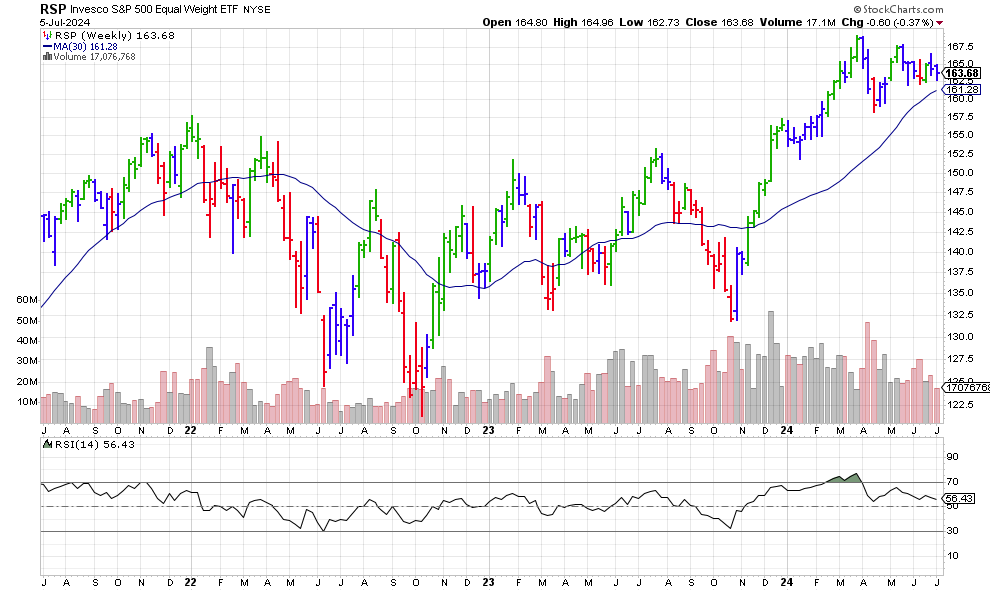
One thing that has been interesting to me is the spread between the capitalization weighted averages and the same equal weight version. The gains have been concentrated in a few large cap names. This has happened a few times in history, generally the big names catch down. However, there is no way to time when that happens.
Courtesy of StockCharts.com
Above we see the equal weight S&P 500. There has not been a new high in this index since March. In fact, it put in a -3% return for the second quarter as the Cap weighted returned almost 5%. The elder bar is blue, which shows indecision. There is also a symmetrical triangle that further shows indecision. Looks like we could get a decent move either way. This week we get CPI data and more testimony from Powell.
3/
A Look Below the Surface
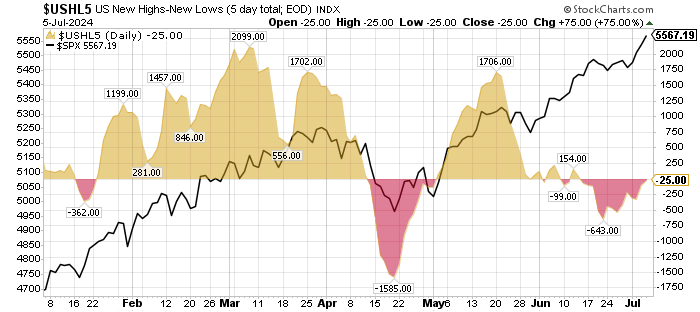
In Dr. Elder’s book “Come into my Trading Room”, he provides a look at weekly new high and new low indicators. I like this one in addition to the cumulative version because you get better short-term divergences for tactical moves.
Courtesy of StockCharts.com
We can clearly see the new all-time highs in the index have not been supported by the broad stock market. While these divergences are not triggers in and of themselves, they are weak conditions. Though the number of new lows is quite small now, the last time we had a divergence of new highs in price, but more 52-week lows was fall of 2021 when the Nasdaq peaked. The Russell 2000 small cap index had peaked many months before. In fact, 950 days+ later, the Russell has not made a new high!
4/
CEG Still in an Uptrend
While there is a case made above for potential near term caution, the trend is still up, and divergences are not triggers. So, let’s look at a couple names.
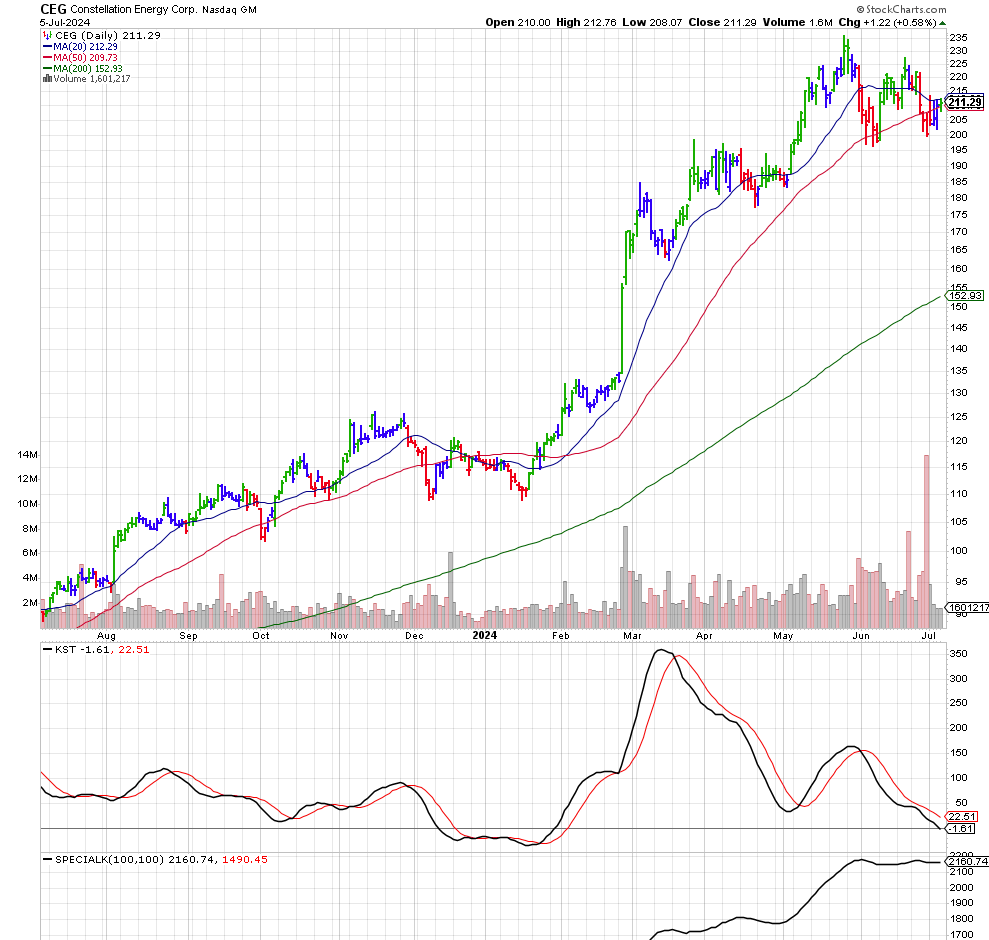
Running a weekly 20-week high momentum trend screen, I see a lot of the leaders we have all heard about. I selected Constellation Energy as this is a name that has also come through a value stock screen this year. I liked the idea as the boom in AI will require more power consumption. This requires investment and growth to certain utility companies.
Courtesy of StockCharts.com
This name has pulled back nicely. The 20 week and 50 week moving averages have converged and played support. There is also a clear support line in the same area. The elder bar turned green on Friday after some consolidation. If the interest rate reaction to last week’s job report continues, there is another tail wind for the sector.
5/
GE Looking to Plot its Next Course
The last idea was a momentum/trend name. I looked through a short list of mean reversion names and there was not much in the large cap space. Looking for squeeze candidates proved a lot more fruitful. A squeeze is when the Bollinger bands are within the Keltner channels. These are volatility-based indicators. The idea is that periods of low volatility led to higher volatility, which is a trader’s friend.
GE healthcare struck me as it is still a strong name that has been a momentum move this year.
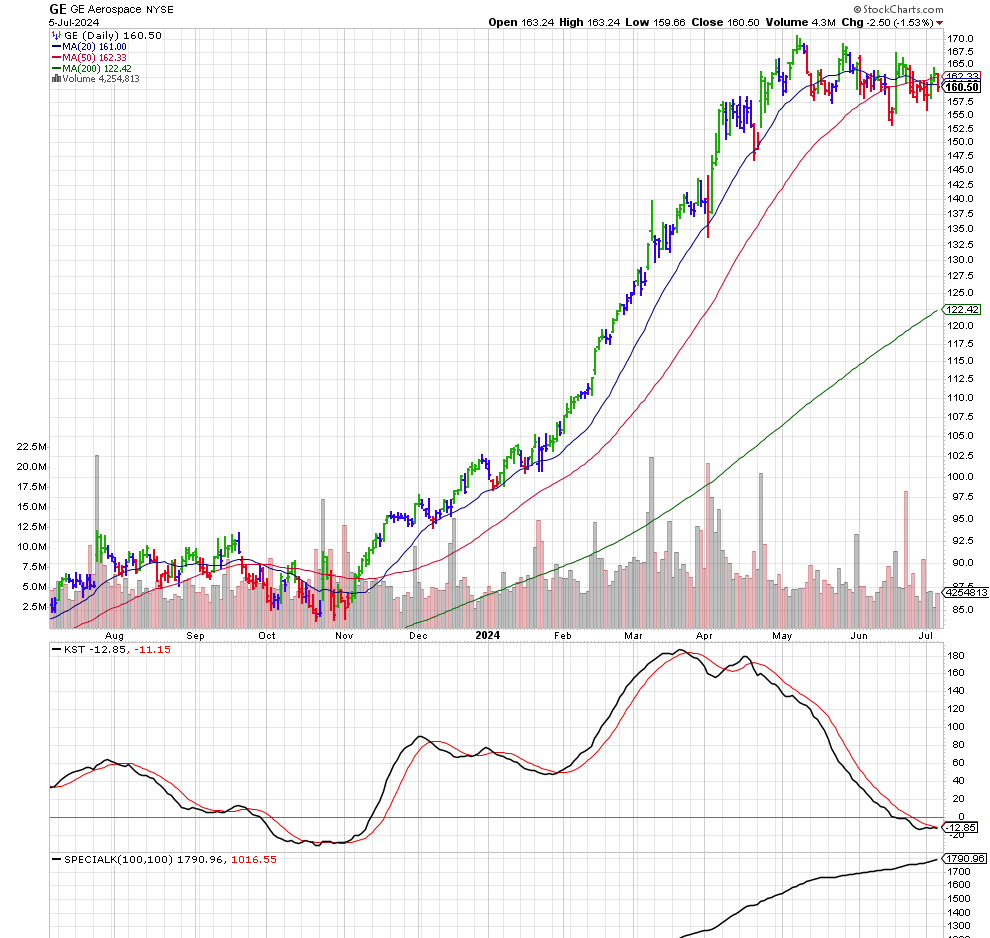
Courtesy of StockCharts.com
The name has been consolidating since April. The longer-term trend indicator, Special-K is still in a buy mode. (Pring’s Special K | ChartSchool | StockCharts.com) The shorter term indicator, the KST is looking to turn up into a buy signal. (Pring’s Know Sure Thing (KST) | ChartSchool | StockCharts.com) The 20 day and 50 day moving averages are tightly converged, further displaying the squeeze reduction in volatility. My one worry is how far away the 200-day moving average is below. The clear trading range gives us levels to watch for a potential breakdown however.
If the range is broken to the upside, this could refresh into another stage 2 advance.
—–
Originally posted 8th July 2024
Disclosure: Investopedia
Investopedia.com: The comments, opinions and analyses expressed herein are for informational purposes only and should not be considered individual investment advice or recommendations to invest in any security or to adopt any investment strategy. While we believe the information provided herein is reliable, we do not warrant its accuracy or completeness. The views and strategies described on our content may not be suitable for all investors. Because market and economic conditions are subject to rapid change, all comments, opinions and analyses contained within our content are rendered as of the date of the posting and may change without notice. The material is not intended as a complete analysis of every material fact regarding any country, region, market, industry, investment or strategy. This information is intended for US residents only.
Disclosure: Interactive Brokers Third Party
Information posted on IBKR Campus that is provided by third-parties does NOT constitute a recommendation that you should contract for the services of that third party. Third-party participants who contribute to IBKR Campus are independent of Interactive Brokers and Interactive Brokers does not make any representations or warranties concerning the services offered, their past or future performance, or the accuracy of the information provided by the third party. Past performance is no guarantee of future results.
This material is from Investopedia and is being posted with its permission. The views expressed in this material are solely those of the author and/or Investopedia and Interactive Brokers is not endorsing or recommending any investment or trading discussed in the material. This material is not and should not be construed as an offer to buy or sell any security. It should not be construed as research or investment advice or a recommendation to buy, sell or hold any security or commodity. This material does not and is not intended to take into account the particular financial conditions, investment objectives or requirements of individual customers. Before acting on this material, you should consider whether it is suitable for your particular circumstances and, as necessary, seek professional advice.
Disclosure: ETFs
Any discussion or mention of an ETF is not to be construed as recommendation, promotion or solicitation. All investors should review and consider associated investment risks, charges and expenses of the investment company or fund prior to investing. Before acting on this material, you should consider whether it is suitable for your particular circumstances and, as necessary, seek professional advice.





Join The Conversation
For specific platform feedback and suggestions, please submit it directly to our team using these instructions.
If you have an account-specific question or concern, please reach out to Client Services.
We encourage you to look through our FAQs before posting. Your question may already be covered!