
- Solve real problems with our hands-on interface
- Progress from basic puts and calls to advanced strategies
Interactive Options Course
Posted May 21, 2026 at 3:36 am
Investopedia is partnering with All Star Charts on this newsletter. The contents of this newsletter are for informational and educational purposes only.
The energy sector broke out before the missiles flew.
In late 2025, XLE, the SPDR Energy Select Sector ETF that tracks the S&P 500 energy sector, cleared a price level that had acted as resistance for more than a decade.
Resistance is a price level where selling pressure has historically stopped an advance, turning buyers back every time they approached it. The Middle East conflict that would send oil to $138 a barrel was still months away.
When the conflict began in late February 2026 and Brent spiked toward $117 in April, energy stocks were already carrying a head start most investors had not noticed.
Why the Breakout Held
When a price level holds as resistance for more than a decade, it means sellers have won every battle at that line for years. Institutions, traders, and long-term investors have all tested it and failed.
When the market finally clears that line, the move matters.
In most breakouts, you expect at least a retest of the breakout zone. Price pulls back and touches that old resistance from above, which now acts as support, meaning a level where buying pressure steps in to prevent further declines.
That process confirms the breakout was real, not a short-lived trade where buyers piled in and quickly exited.
XLE never came back to test that level.
Buyers stepped in well above the old resistance zone during the pullback. That is not what weak breakouts look like. It tells you there was genuine conviction behind the move.
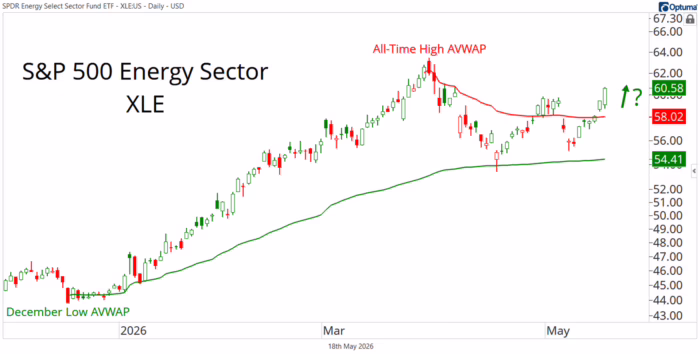
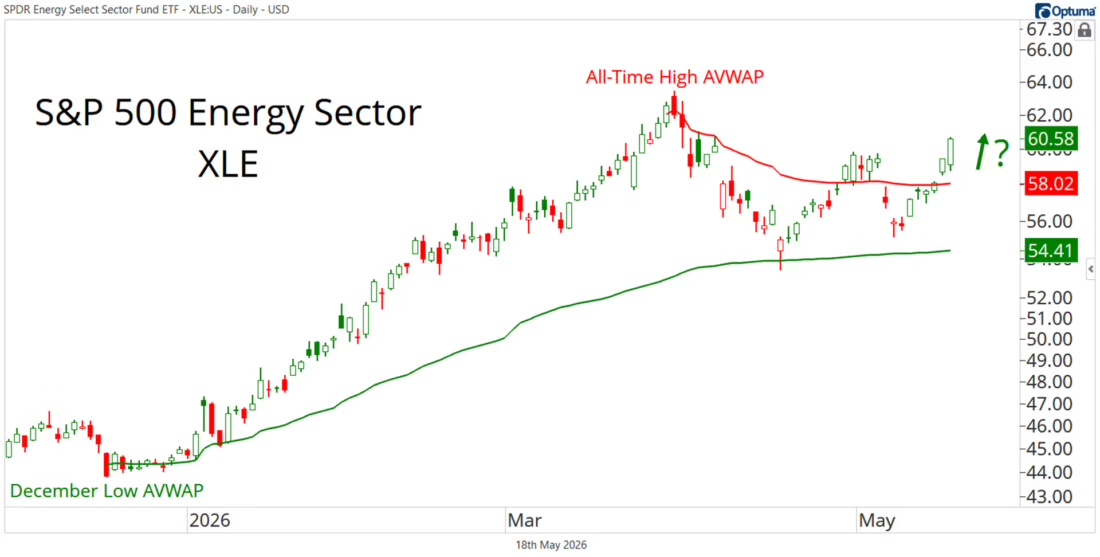
Reading the Two AVWAPs
The chart displays two Anchored VWAPs, or AVWAPs. An AVWAP is the average price of a security weighted by trading volume, anchored from a specific date or event. Unlike a traditional moving average that weights every period equally, an AVWAP reflects where real positioning happened by weighting each price level by the volume that traded there.
The red line is the AVWAP anchored from XLE’s all-time high. Think of it as the average price paid by every buyer since the peak, with busier price levels counting more than quieter ones. When price is below that line, sellers who bought near the top are still in control.
When price reclaims it, buyers have worked through that selling pressure and reclaimed control.
XLE has now recaptured that level, with price at $60.58 sitting above the all-time high AVWAP at $58.02.
Three Conditions on One Chart
The breakout cleared a line that sellers had defended for over ten years. On the pullback, buyers held above the breakout zone, suggesting sellers could not reclaim what they lost. XLE has now added a third confirmation by recapturing the AVWAP anchored from the all-time high.
Together they represent about as clean a technical setup as you can ask for on a weekly chart.
The green AVWAP anchored from the December low sits at $54.41, marking where longer-term demand entered the picture. Price has held well above that level through the recent sideways period, which is what consolidation looks like: price pausing and building a base without breaking down. That rules out the deep breakdown that would call the whole setup into question.
What This Means for Investors
The buyers who showed up on the breakout have not left. The recent sideways price action looks like consolidation, not distribution.
Distribution occurs when large sellers quietly unwind positions in an advancing market. It typically leaves a different signature: high-volume selling, failed breakout attempts, and lower highs. None of those are present here.
The setup remains constructive as long as the price holds above the all-time high AVWAP and the long-term breakout zone.
A move back below either of those levels would change the picture. Until that happens, the brief pause looks like exactly that: a pause.
If you want actionable ideas on how to trade this setup, check out our daily free e-letter.
—
Originally posted 20th May 2026
Investopedia.com: The comments, opinions and analyses expressed herein are for informational purposes only and should not be considered individual investment advice or recommendations to invest in any security or to adopt any investment strategy. While we believe the information provided herein is reliable, we do not warrant its accuracy or completeness. The views and strategies described on our content may not be suitable for all investors. Because market and economic conditions are subject to rapid change, all comments, opinions and analyses contained within our content are rendered as of the date of the posting and may change without notice. The material is not intended as a complete analysis of every material fact regarding any country, region, market, industry, investment or strategy. This information is intended for US residents only.
Information posted on IBKR Campus that is provided by third-parties does NOT constitute a recommendation that you should contract for the services of that third party. Third-party participants who contribute to IBKR Campus are independent of Interactive Brokers and Interactive Brokers does not make any representations or warranties concerning the services offered, their past or future performance, or the accuracy of the information provided by the third party. Past performance is no guarantee of future results.
This material is from Investopedia and is being posted with its permission. The views expressed in this material are solely those of the author and/or Investopedia and Interactive Brokers is not endorsing or recommending any investment or trading discussed in the material. This material is not and should not be construed as an offer to buy or sell any security. It should not be construed as research or investment advice or a recommendation to buy, sell or hold any security or commodity. This material does not and is not intended to take into account the particular financial conditions, investment objectives or requirements of individual customers. Before acting on this material, you should consider whether it is suitable for your particular circumstances and, as necessary, seek professional advice.
Any discussion or mention of an ETF is not to be construed as recommendation, promotion or solicitation. All investors should review and consider associated investment risks, charges and expenses of the investment company or fund prior to investing. Before acting on this material, you should consider whether it is suitable for your particular circumstances and, as necessary, seek professional advice.
Related Articles


Join The Conversation
For specific platform feedback and suggestions, please submit it directly to our team using these instructions.
If you have an account-specific question or concern, please reach out to Client Services.
We encourage you to look through our FAQs before posting. Your question may already be covered!