1/ What Does the Market Think of the ISM?
2/ Jobs will be Important This Week
3/ This Tried-and-True Measure is Flashing a Yellow Signal
4/ The Most Important Measure of Them
Investopedia is partnering with CMT Association on this newsletter. The contents of this newsletter are for informational and educational purposes only, however, and do not constitute investing advice. The guest authors, which may sell research to investors, and may trade or hold positions in securities mentioned herein do not represent the views of CMT Association or Investopedia. Please consult a financial advisor for investment recommendations and services.
1/ What Does the Market Think of the ISM?
Yesterday we looked at intermarket analysis. We wanted to understand how traders and investors can find information in other markets that can help inform their opinions. For me, I like to use this to avoid Confirmation Bias. This bias is a behavioral bias in finance whereby traders and investors only look for information that confirms their view. How true is that on social media today?

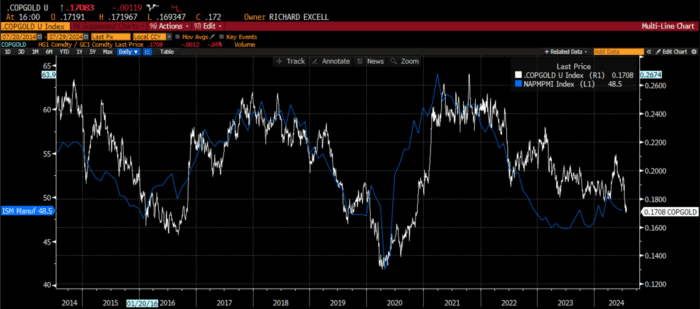
Source: StayVigilant.Substack.com, Bloomberg
In order to avoid this, I look to other markets to see the interpretation of events. For example, I pay close attention to economic data. There is always the debate between the hard data (e.g. GDP) and soft data (e.g. ISM). We get the ISM data today which is what I prefer because it coincides with the financial markets and it is not subject to the revisions that the hard data is. However, the ISM has told us all year that the economy is not as good as the GDP is telling us. Thus, I look to the commodity markets, especially the metals. Industrial metals are most impacted by the strength or weakness in the economy. I look at copper – which is affected by plumbing, electricity, the grid, EVs – and divide it by the gold price to take the FX effects out. When I look at this ratio, I see that the commodity markets agree that the economy may not be as robust as the GDP data tell us.
2/ Jobs will be Important This Week
This week we will also get the non-farms payroll data on Friday. On jobs day, I always feel the story is within the story and not the headline data itself, which will be revised in the next three months, is subject to seasonal birth/death, and has a standard error larger than the headline itself.

Source: StayVigilant.Substack.com, Bloomberg
A component within the data that has drawn considerable attention of late is the 3-month moving average of the unemployment rate. Federal Reserve researchers created something called the Sahm Rule. It states that when the 3-month moving average of unemployment moves more than 0.50 from the lows, we have a recession. I have created a visual of that Rule in the chart above.
You can see that it is at 0.43 right now and a move higher by 0.2 or more could put us in that area of 0.50. Look back to the last 50 years of data. The recessions are the red shaded areas. The horizontal line is at 0.50. When the measure hits 0.50, we ALWAYS have a recession with no exceptions. Does that put extra importance on the number this Friday?
3/ This Tried-and-True Measure is Flashing a Yellow Signal
Another metric that has a very good track record at forecasting the economy is the yield curve. The yield curve has gotten negative headlines lately because it inverted last year and yet we have not seen a recession yet. In fact, it inverted by the most we have seen since the 1980s, yet no recession.

Source: StayVigilant.Substack.com, Bloomberg
The reality, however, is it isn’t the inversion that predicts the recession, it is when the yield curve re-steepens past zero. You see, when it inverts, there have been recessions, but the lag time is long and variable. When it re-steepens we have a recession almost immediately.
In the past few weeks, the curve has been steepening from -100 to -22. It has still not moved above 0, but it is getting closer. Is this another signal telling us to be careful? Could the yield curve redeem its image?
4/ The Most Important Measure of Them
When it all comes down to it, all this talk of the economy has to impact markets, or we only care a little bit i.e. if our own job is affected. The main thrust by which it impacts markets is through the 10-year yield itself. This yield is the price upon which all other assets are priced: other sovereign debt, corporate credit, equity multiples and even commodity curves. It is the golden rule itself.

Source: StayVigilant.Substack.com, Bloomberg
You can see that the 10-year yield has been moving lower, from a high last year of 5%, to a high this year of 4.6% and current level of 4.17%. This is a series of lower highs, even if we have yet to see a series of lower lows. The price action is forming a pennant pattern that looks to be at risk of breaking on the downside. As it has already moved below shorter-term moving averages like the 1- and 3-month, I am watching closely to see if it moves down to the 3.43% 150-day moving average that has defined the trend in the last 5 years.
Even if the economic data appears to be weak, this could be good news for bond markets, as lower yields mean higher prices. It ultimately would lead to the self-correcting mechanism of capitalism as well, with lower 10-year yields meaning lower mortgage rates for homeowners, lower cost to expand for corporations, and cheaper source of leverage for traders. We have an important week for data, make sure you are looking for as many indicators as possible to avoid the Confirmation Bias.
Stay Vigilant!
About This Week’s Author
Rich Excell, CFA, CMT is a 30-year hedge fund and proprietary trading veteran who has lived and worked in Asia and Europe in addition to the United States. He has run investment businesses spanning equities, fixed income, commodities and foreign exchange. Rich is now a Clinical Assistant Professor of Finance at the Gies College of Business, University of Illinois, Urbana-Champaign. He also is the host of the Investment Exchange Forum and Macro Matters podcasts for the CFA Society Chicago and writes a bi-weekly options trading blog ‘Excell with Options’ for the CME Group. Finally, he writes a weekly Substack blog called ‘Stay Vigilant’ which aims to demystifinance for the average investor.
———————————————-
Originally posted on July 31st, 2024
Disclosure: Investopedia
Investopedia.com: The comments, opinions and analyses expressed herein are for informational purposes only and should not be considered individual investment advice or recommendations to invest in any security or to adopt any investment strategy. While we believe the information provided herein is reliable, we do not warrant its accuracy or completeness. The views and strategies described on our content may not be suitable for all investors. Because market and economic conditions are subject to rapid change, all comments, opinions and analyses contained within our content are rendered as of the date of the posting and may change without notice. The material is not intended as a complete analysis of every material fact regarding any country, region, market, industry, investment or strategy. This information is intended for US residents only.
Disclosure: Interactive Brokers Third Party
Information posted on IBKR Campus that is provided by third-parties does NOT constitute a recommendation that you should contract for the services of that third party. Third-party participants who contribute to IBKR Campus are independent of Interactive Brokers and Interactive Brokers does not make any representations or warranties concerning the services offered, their past or future performance, or the accuracy of the information provided by the third party. Past performance is no guarantee of future results.
This material is from Investopedia and is being posted with its permission. The views expressed in this material are solely those of the author and/or Investopedia and Interactive Brokers is not endorsing or recommending any investment or trading discussed in the material. This material is not and should not be construed as an offer to buy or sell any security. It should not be construed as research or investment advice or a recommendation to buy, sell or hold any security or commodity. This material does not and is not intended to take into account the particular financial conditions, investment objectives or requirements of individual customers. Before acting on this material, you should consider whether it is suitable for your particular circumstances and, as necessary, seek professional advice.


Join The Conversation
For specific platform feedback and suggestions, please submit it directly to our team using these instructions.
If you have an account-specific question or concern, please reach out to Client Services.
We encourage you to look through our FAQs before posting. Your question may already be covered!