
- Solve real problems with our hands-on interface
- Progress from basic puts and calls to advanced strategies
Interactive Options Course
Posted April 30, 2025 at 5:12 am
From SIA Charts
1/ Target Corp (TGT)
2/ Candlestick Chart
3/ Point and Figure Chart
Investopedia is partnering with CMT Association on this newsletter. The contents of this newsletter are for informational and educational purposes only, however, and do not constitute investing advice. The guest authors, which may sell research to investors, and may trade or hold positions in securities mentioned herein do not represent the views of CMT Association or Investopedia. Please consult a financial advisor for investment recommendations and services.
Target Corp (TGT)
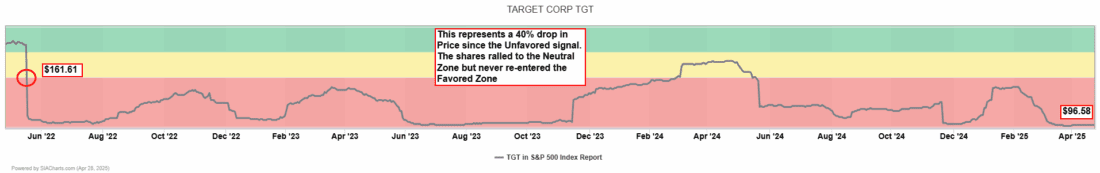
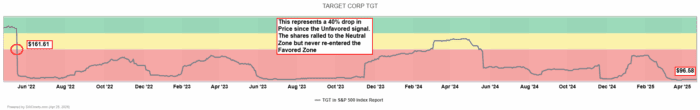
The last time we highlighted Target Corp (TGT) in our Daily Stock Report was on August 13, 2024. Back then, the shares were exhibiting a steady downtrend following its peak in late 2021. The shares were deeply entrenched in the unfavored red zone of many of the reports it was found in on the SIA Platform including the SIA S&P 500 Index. The SIA Platform issued a Red Unfavored signal back on May 18, 2022, at a price of $161.61. At the time of our last commentary on August 13, 2024, the shares were at $135.02 which represented an approximately 17% drop in price since the red unfavored zone signal. Since then, the shares have continued to weaken and the current closing price is $96.58, which represents an additional 28% drop since the August 13, 2024, closing price. This represents a total decline in price of approximately 40% since May of 2022.
This exemplifies the value of staying away from investments in the red unfavored zone. Many advisors may instinctively look for names in the unfavored zone with the mentality that the shares are oversold and a “value buy” is in play. However, “value buys” may, in fact, be “value traps” and the shares may continue to fall further in price which is what has occurred in this example of (TGT). This investigation reinforces SIA’s methodology not to pursue a “contrarian” mindset to names in the unfavored zone which are not exhibiting any relative strength as the sellers are in control and not many market participants are looking at the name.
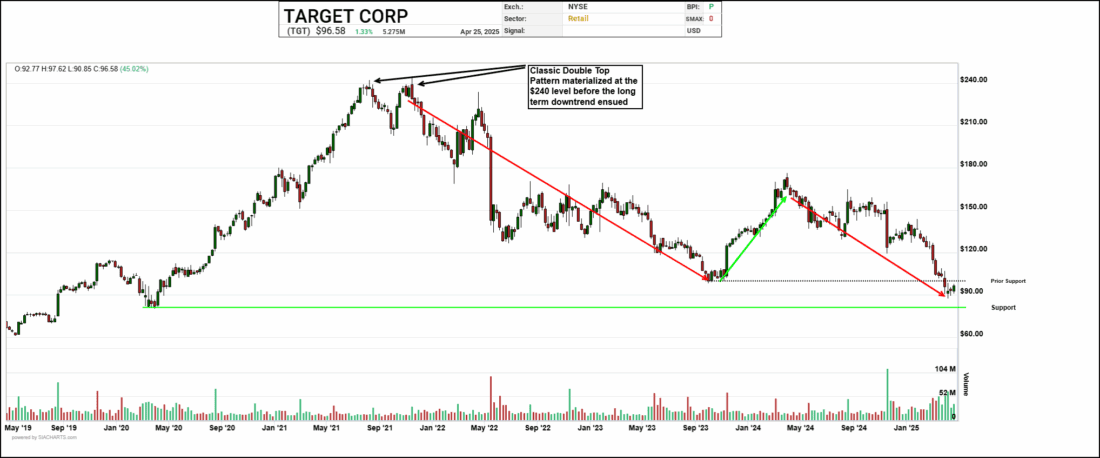
Candlestick Chart
Let’s dive in and analyze the candlestick chart to consider what may lie ahead for Target Corp. Back in August of 2021, and November of 202, we see a classic double top pattern where the shares bumped its head at the $240.00 level before the long term downtrend materialized. The shares found support at the $100 psychological zone back in Oct 2023, and a brief rally occurred where the shares finally hit a ceiling at $175 in April of 2024, before a downtrend resumed once again. Now most recently we see the $100 whole number support level failed to hold and the shares established a lower low. Next support may be found at the $80.00 area where the shares were trading at back in March 2020. To the upside, resistance is at $100 as prior support now becomes new resistance.
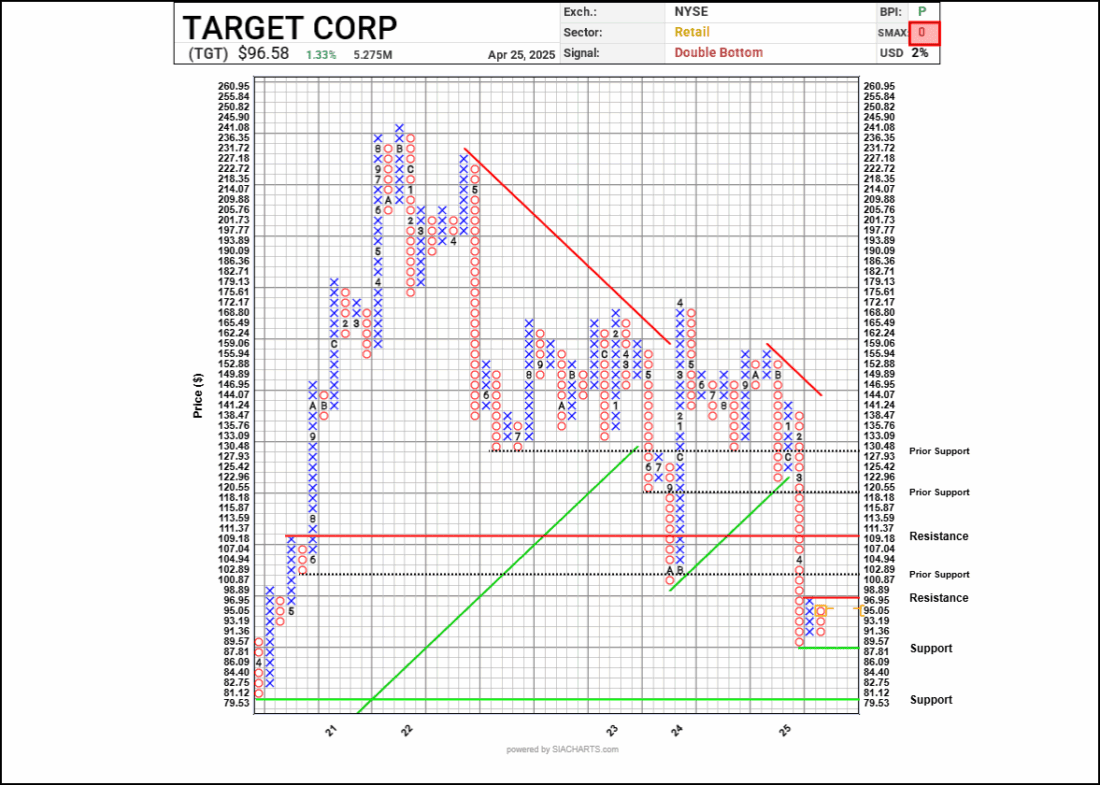
Point and Figure Chart
In looking at the candlestick chart we see a steady downtrend in place since late 2021. In our last report on Target back in August, we identified the $130, $120, and $101 area as possible support levels which has failed to hold. Currently, the shares have already broken below those levels, and a new lower low has materialized earlier this month when the shares could not hold at the psychological $100 level. The next possible area of support can now be found at $87.81 and, below that, $79.53. If the shares can rally to the upside, resistance is at its 3-box reversal of $98.89, which is close the $100 whole number and psychological level. If it can break above this number, next resistance will be at $111.37. With a SMAX score of 0 out of 10, TGT is exhibiting no strength whatsoever against the asset classes.
—
Originally posted 29th April 2025
Investopedia.com: The comments, opinions and analyses expressed herein are for informational purposes only and should not be considered individual investment advice or recommendations to invest in any security or to adopt any investment strategy. While we believe the information provided herein is reliable, we do not warrant its accuracy or completeness. The views and strategies described on our content may not be suitable for all investors. Because market and economic conditions are subject to rapid change, all comments, opinions and analyses contained within our content are rendered as of the date of the posting and may change without notice. The material is not intended as a complete analysis of every material fact regarding any country, region, market, industry, investment or strategy. This information is intended for US residents only.
Information posted on IBKR Campus that is provided by third-parties does NOT constitute a recommendation that you should contract for the services of that third party. Third-party participants who contribute to IBKR Campus are independent of Interactive Brokers and Interactive Brokers does not make any representations or warranties concerning the services offered, their past or future performance, or the accuracy of the information provided by the third party. Past performance is no guarantee of future results.
This material is from Investopedia and is being posted with its permission. The views expressed in this material are solely those of the author and/or Investopedia and Interactive Brokers is not endorsing or recommending any investment or trading discussed in the material. This material is not and should not be construed as an offer to buy or sell any security. It should not be construed as research or investment advice or a recommendation to buy, sell or hold any security or commodity. This material does not and is not intended to take into account the particular financial conditions, investment objectives or requirements of individual customers. Before acting on this material, you should consider whether it is suitable for your particular circumstances and, as necessary, seek professional advice.
Related Articles


Join The Conversation
For specific platform feedback and suggestions, please submit it directly to our team using these instructions.
If you have an account-specific question or concern, please reach out to Client Services.
We encourage you to look through our FAQs before posting. Your question may already be covered!