
- Solve real problems with our hands-on interface
- Progress from basic puts and calls to advanced strategies
Interactive Options Course

Posted March 20, 2025 at 9:03 am
1/ Seasonal Patterns
Investopedia is partnering with CMT Association on this newsletter. The contents of this newsletter are for informational and educational purposes only, however, and do not constitute investing advice. The guest authors, which may sell research to investors, and may trade or hold positions in securities mentioned herein do not represent the views of CMT Association or Investopedia. Please consult a financial advisor for investment recommendations and services.
Seasonal Patterns
Seasonality charts look at historical price patterns and performance which can help to find recurring patterns and market behaviour at certain times of the year. As of Monday’s close, this has been the worst start to the month of March (-4.7% after 13 trading days) since 2020 when Covid was causing global chaos. However, when looking at average March performance the second half has historically been much stronger, closing an average 1.5% higher from February’s close. Here’s a chart showing the average day-by-day performance for every March since 1998:
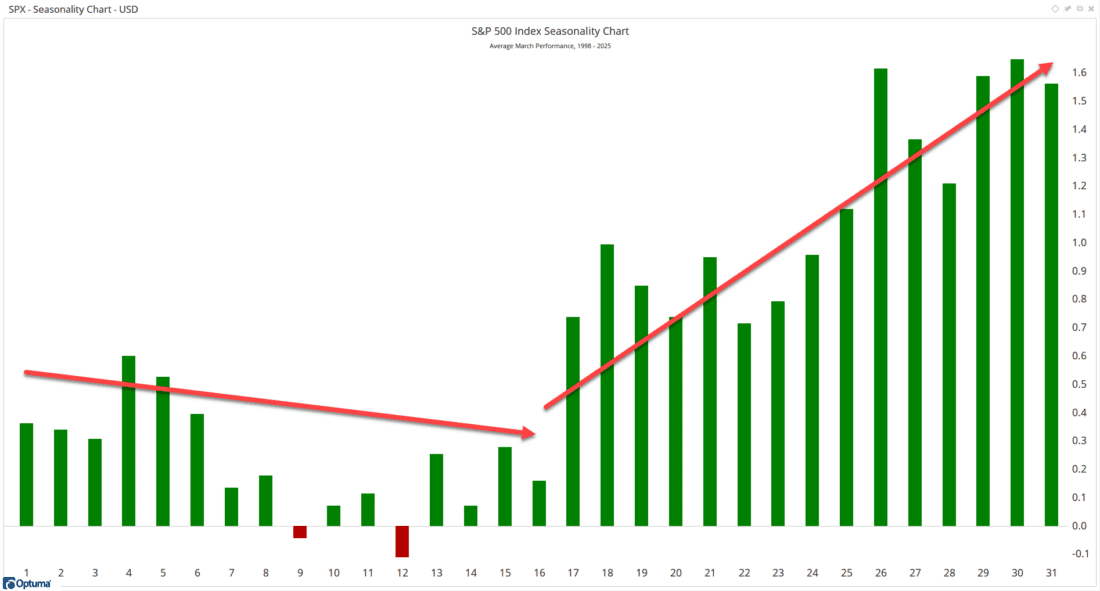
Courtesy of Optuma
On a sector basis, the best performer for March has been Utilities $XLU with an average gain of 1.81% since its launch in 1998, followed by Consumer Discretionary $XLY at 1.70%. Given the current weakness, all sectors (bar Energy) are in the red so far this month, with Consumer Discretionary down 8.7%. Historically the 17th marks the start of rapid improvement for the next couple of weeks, so it will be interesting to see if the pattern repeats ($XLY had its first positive Monday since February 10th, and closed almost 2% higher on Wednesday, so it’s a good start!).
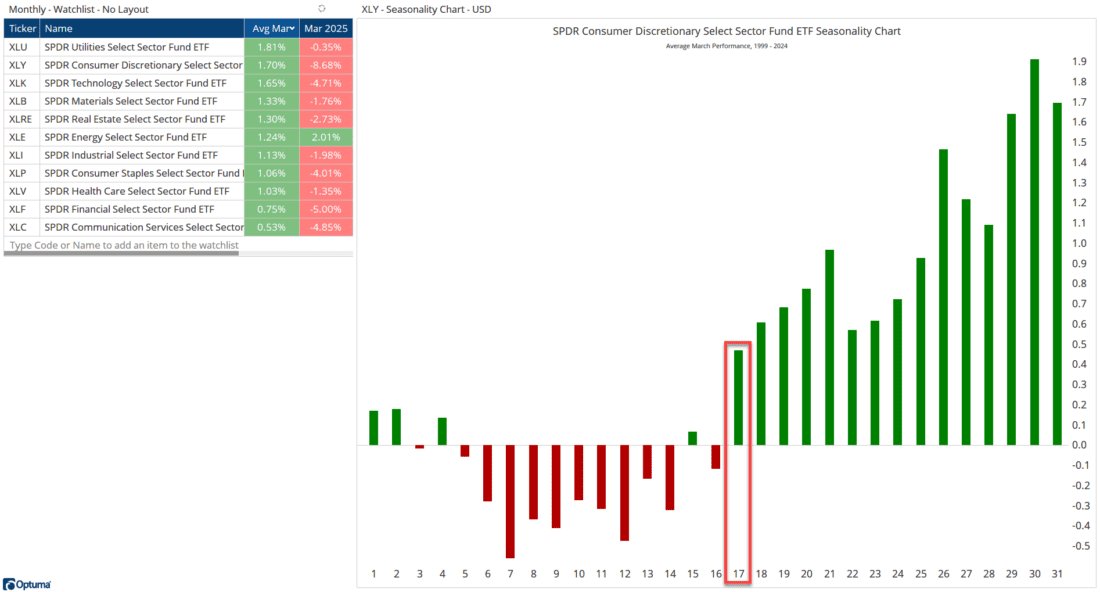
Courtesy of Optuma
Looking at the US Presidential Cycle and longer-term seasonality, Year 1 of the presidency usually starts sideways before resuming an uptrend in early April to finish the year 8% higher. Here’s the average annual performance, and where we currently are after the first 50 trading days of the year:
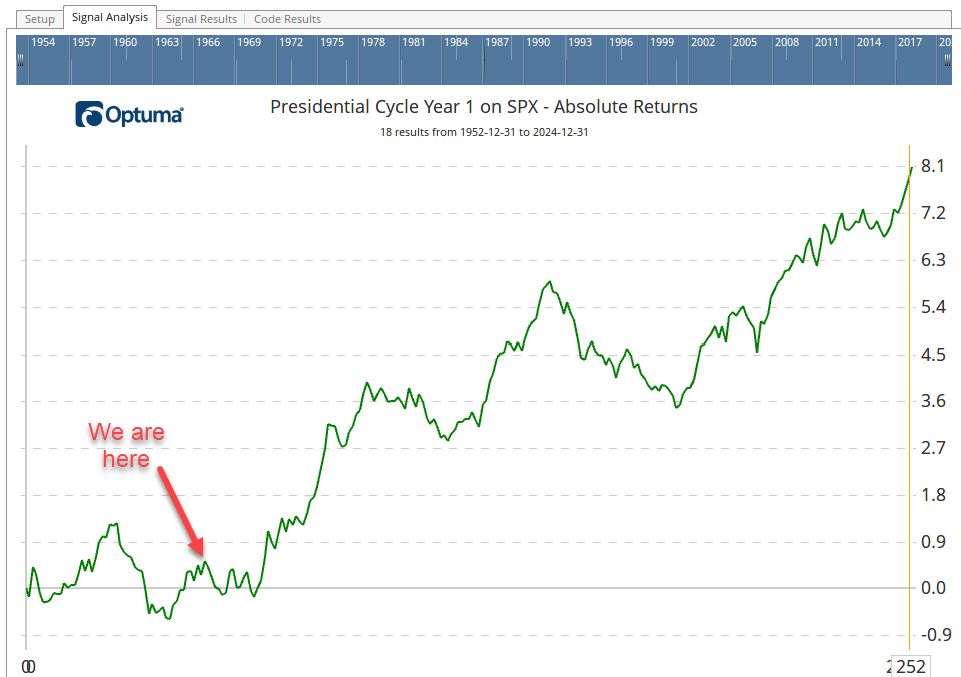
Courtesy of Optuma
—-
Originally posted 20th March 2025
Investopedia.com: The comments, opinions and analyses expressed herein are for informational purposes only and should not be considered individual investment advice or recommendations to invest in any security or to adopt any investment strategy. While we believe the information provided herein is reliable, we do not warrant its accuracy or completeness. The views and strategies described on our content may not be suitable for all investors. Because market and economic conditions are subject to rapid change, all comments, opinions and analyses contained within our content are rendered as of the date of the posting and may change without notice. The material is not intended as a complete analysis of every material fact regarding any country, region, market, industry, investment or strategy. This information is intended for US residents only.
Information posted on IBKR Campus that is provided by third-parties does NOT constitute a recommendation that you should contract for the services of that third party. Third-party participants who contribute to IBKR Campus are independent of Interactive Brokers and Interactive Brokers does not make any representations or warranties concerning the services offered, their past or future performance, or the accuracy of the information provided by the third party. Past performance is no guarantee of future results.
This material is from Investopedia and is being posted with its permission. The views expressed in this material are solely those of the author and/or Investopedia and Interactive Brokers is not endorsing or recommending any investment or trading discussed in the material. This material is not and should not be construed as an offer to buy or sell any security. It should not be construed as research or investment advice or a recommendation to buy, sell or hold any security or commodity. This material does not and is not intended to take into account the particular financial conditions, investment objectives or requirements of individual customers. Before acting on this material, you should consider whether it is suitable for your particular circumstances and, as necessary, seek professional advice.
Any discussion or mention of an ETF is not to be construed as recommendation, promotion or solicitation. All investors should review and consider associated investment risks, charges and expenses of the investment company or fund prior to investing. Before acting on this material, you should consider whether it is suitable for your particular circumstances and, as necessary, seek professional advice.
Related Articles


")


Join The Conversation
For specific platform feedback and suggestions, please submit it directly to our team using these instructions.
If you have an account-specific question or concern, please reach out to Client Services.
We encourage you to look through our FAQs before posting. Your question may already be covered!