
- Solve real problems with our hands-on interface
- Progress from basic puts and calls to advanced strategies
Interactive Options Course
Posted August 14, 2025 at 9:23 am
By Todd Stankiewicz CMT, CFP, ChFC
1/ Rate Cuts Ahead?
2/ Sector Rotation Signals from RRGs
3/ GLD Weekly Chart – Bollinger Band Analysis
Investopedia is partnering with CMT Association on this newsletter. The contents of this newsletter are for informational and educational purposes only, however, and do not constitute investing advice. The guest authors, which may sell research to investors, and may trade or hold positions in securities mentioned herein do not represent the views of CMT Association or Investopedia. Please consult a financial advisor for investment recommendations and services.
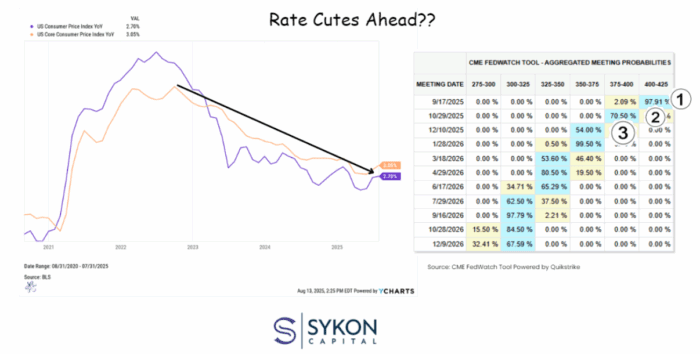
Rate Cuts Ahead?
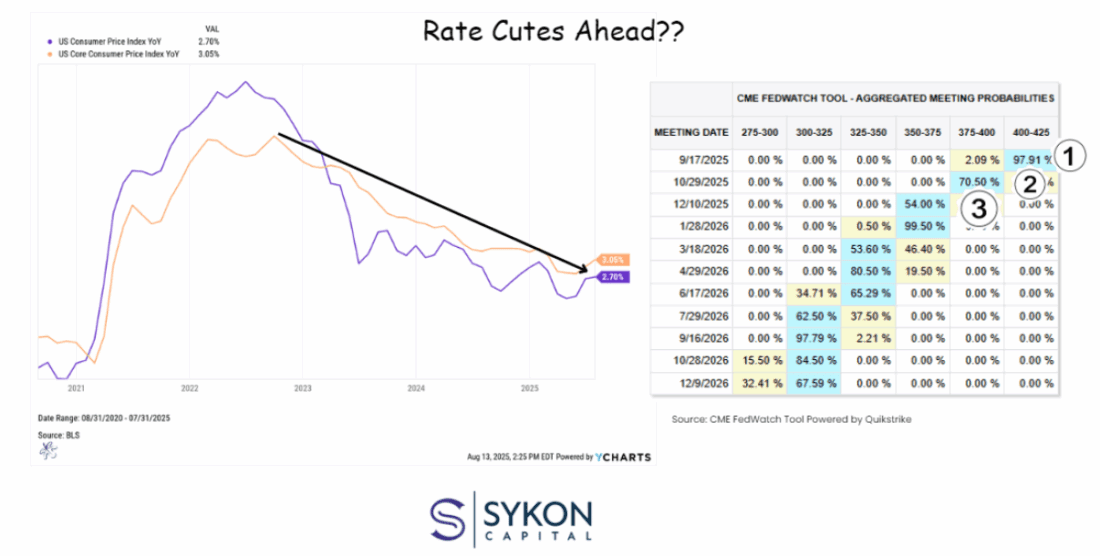
This week’s CPI report came in slightly below expectations, but Core CPI was a touch hotter than forecast.
Despite that, the market has doubled down on its rate cut bets.
The optimism is clear and equities are rallying, yields are easing, and traders are talking about a Santa Claus rally before we’ve even hit fall.
But here’s the risk:
If the Fed doesn’t match this script, sentiment could flip fast. That could mean sharp volatility, failed breakouts, and a quick test of support levels.
From a technical perspective:
What to watch into September:
The bottom line:
The market is trading on a dovish story, not confirmed policy. That can work in the short term, but if the Fed blinks, technical setups could reverse quickly.
Sector Rotation Signals from RRGs

If you’ve followed my work, you know I’m a big fan of Relative Rotation Graphs (RRGs).
They’re one of the best ways to visualize sector performance relative to a benchmark, in this case, the S&P 500 Equal Weight ETF (RSP).
By focusing on equal weight sectors, we strip out mega-cap distortions and get a cleaner read on broad market rotation.
Current observations:
Why utilities matter here:
Key technical takeaways:
The bottom line:
Sector rotation is gaining complexity, and opportunity. Watching the RRGs gives us a potential edge in spotting these shifts before they’re obvious on price charts.
GLD Weekly Chart – Bollinger Band Analysis
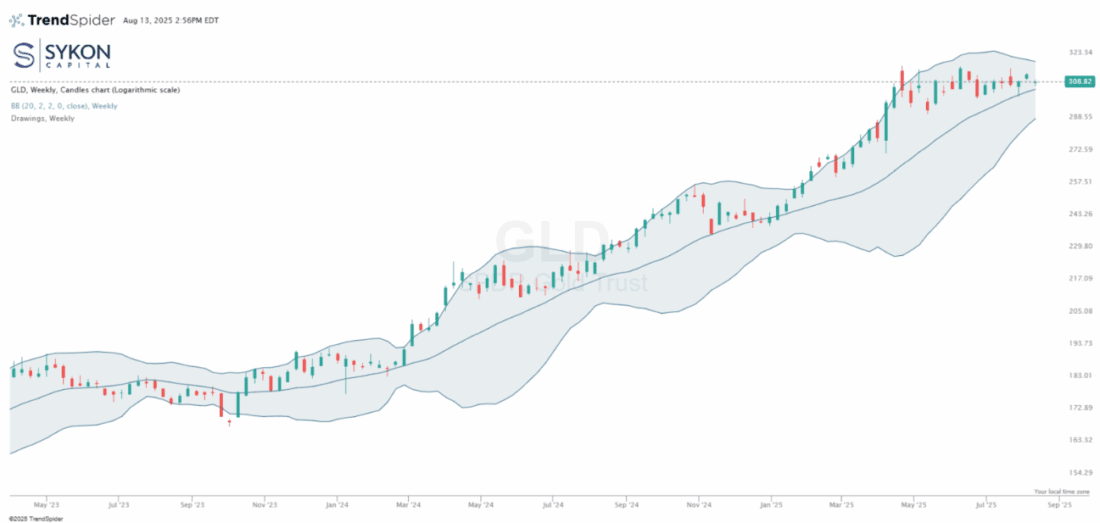
The weekly chart of GLD shows a strong, sustained uptrend that began in early 2023. Price has moved from roughly $170 to around $308, an 81% gain over about 2.5 years, with a clear stair-step pattern of higher highs and higher lows.
Current technical picture:
Support levels:
Resistance levels:
Probability assessment:
Bottom line:
The technical structure favors continuation of the uptrend, but a clean close below $300 would shift focus to deeper support. For now, the path of least resistance remains to the upside.
—
Originally posted 14th August 2025
Investopedia.com: The comments, opinions and analyses expressed herein are for informational purposes only and should not be considered individual investment advice or recommendations to invest in any security or to adopt any investment strategy. While we believe the information provided herein is reliable, we do not warrant its accuracy or completeness. The views and strategies described on our content may not be suitable for all investors. Because market and economic conditions are subject to rapid change, all comments, opinions and analyses contained within our content are rendered as of the date of the posting and may change without notice. The material is not intended as a complete analysis of every material fact regarding any country, region, market, industry, investment or strategy. This information is intended for US residents only.
Information posted on IBKR Campus that is provided by third-parties does NOT constitute a recommendation that you should contract for the services of that third party. Third-party participants who contribute to IBKR Campus are independent of Interactive Brokers and Interactive Brokers does not make any representations or warranties concerning the services offered, their past or future performance, or the accuracy of the information provided by the third party. Past performance is no guarantee of future results.
This material is from Investopedia and is being posted with its permission. The views expressed in this material are solely those of the author and/or Investopedia and Interactive Brokers is not endorsing or recommending any investment or trading discussed in the material. This material is not and should not be construed as an offer to buy or sell any security. It should not be construed as research or investment advice or a recommendation to buy, sell or hold any security or commodity. This material does not and is not intended to take into account the particular financial conditions, investment objectives or requirements of individual customers. Before acting on this material, you should consider whether it is suitable for your particular circumstances and, as necessary, seek professional advice.
Any discussion or mention of an ETF is not to be construed as recommendation, promotion or solicitation. All investors should review and consider associated investment risks, charges and expenses of the investment company or fund prior to investing. Before acting on this material, you should consider whether it is suitable for your particular circumstances and, as necessary, seek professional advice.
Related Articles


Join The Conversation
For specific platform feedback and suggestions, please submit it directly to our team using these instructions.
If you have an account-specific question or concern, please reach out to Client Services.
We encourage you to look through our FAQs before posting. Your question may already be covered!