
- Solve real problems with our hands-on interface
- Progress from basic puts and calls to advanced strategies
Interactive Options Course
Posted March 24, 2025 at 11:08 am
1/ The Stop-Go Method
2/ The 50% VIX Solution
3/ Momentum Precedes Price
Investopedia is partnering with CMT Association on this newsletter. The contents of this newsletter are for informational and educational purposes only, however, and do not constitute investing advice. The guest authors, which may sell research to investors, and may trade or hold positions in securities mentioned herein do not represent the views of CMT Association or Investopedia. Please consult a financial advisor for investment recommendations and services.
The Stop-Go Method
Some investors believe that the recent 10% pull back on the S&P 500 baked-in all the bad news for 2025, and that from here we should comfortably rise. To these investors it looks like a great time to be a buyer. But perhaps a bit of caution is in order, at least until Friday’s Personal Consumption Expenditures (PCE) inflation number is printed.
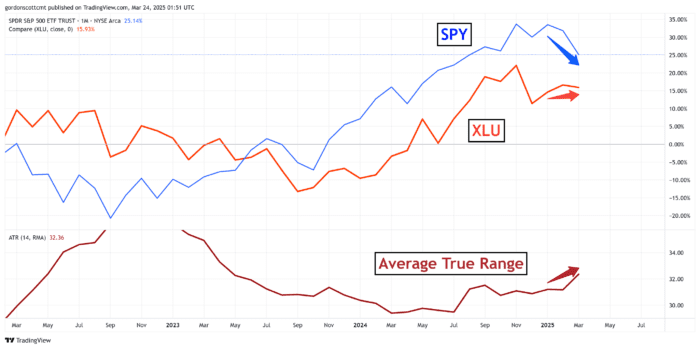
In 2013 I co-authored a book with Toni Turner in which we published our research that included a unique method of measuring the relative strength of the S&P 500 (SPX) with the Utility sector as tracked by the State Street SPDR Utility sector ETF (XLU).
This was intended to be a simple indicator of the coming of a bear market. It is not a frequent signal, making only 5 to 7 appearances per decade, however, this signal often coincided with a continuing downtrend that would last two to twelve months. At the time we published the book, the signal had a track record of accurately preceding such drawdowns 90% of the time over an 85-year period. The curious need wait no longer to review its current state (see below).

The signal has not yet fully formed. The bear signal needs to show both an outperformance of XLU over SPX and a consecutive increase of the average true range (ATR) for a two-month period. The current chart certainly shows XLU outperforming SPX for two months straight, but the ATR needs to see another month of volatility increase before declaring that a bear market will follow. That indication could be final as early as April 15th (half way through the second month).
This bears watching because it means the market is potentially at a critical inflection point. If price volatility continues to increase over the next two to three weeks, it will translate into a warning signal that 2025 still has more downside to come.
The 50% VIX Solution
A shorter-term outlook gives investors a bit of hope however. The Volatility Index (VIX), a measure of option price behavior, has completed more than a 50% pullback from its recent peak. Historically this is a bullish indication for the coming one to three months (see chart).
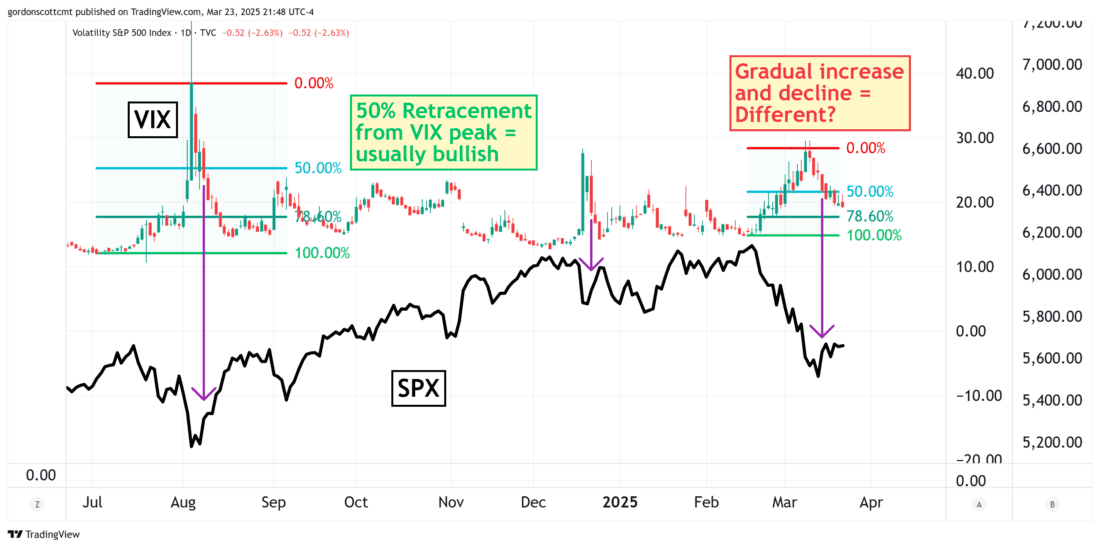
However this 50% retracement rule that I use is typically effective on quick spikes that shock the market and scare investors away for a bit. The most recent price action shows that the rise, and subsequent retracement in VIX prices, has occurred gradually. That would seem to indicate that worry among investors is gradually strengthening, and with the VIX still holding a price level near 20, it may not have hit its ultimate peak just yet.
Momentum Precedes Price
To provide a little optimism to those bullish investors who may feel as though they are currently clinging to a market cliff by no more than their fingernails, I’d like to introduce a concept championed in the 1950s by market analyst and author George C. Lane. He is the inventor of the popular Stochastic oscillator commonly used by technical analysts and traders.
The indicator today is better known than the idea Lane had for creating it in the first place–which is a pity since this idea is actually rather novel and well developed. Lane believed that “Momentum precedes price.” It was more commonly assumed in Lane’s day (and perhaps still is) that volume precedes price, however he rejected that notion. He built the Stochastic oscillator to track momentum.
To capture the essence of Lane’s idea, I have added a 14-day Donchian channel indicator to the price chart and placed the 14-day Stochastic oscillator below (orange line).
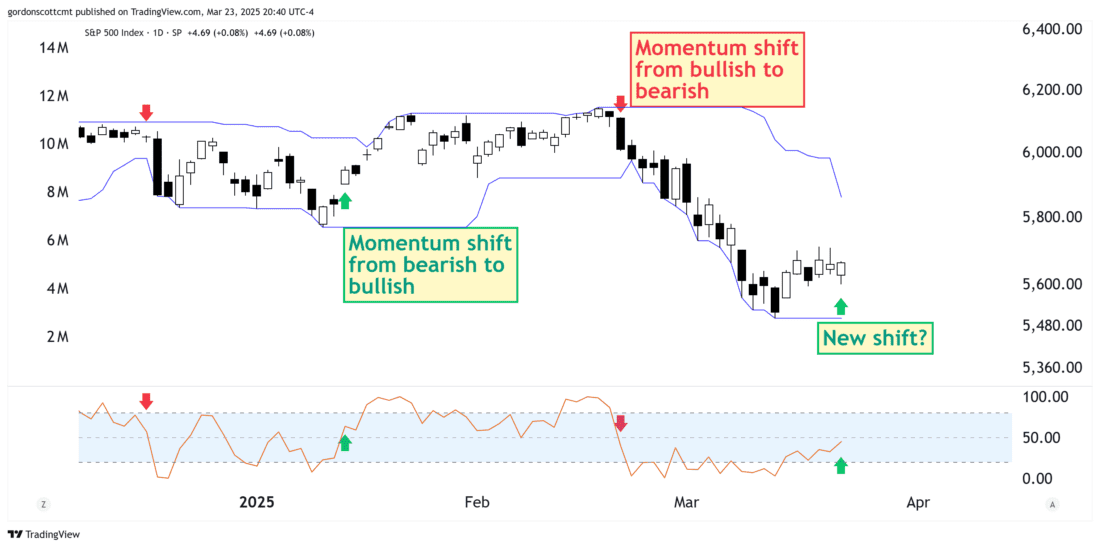
It takes a hot second to train your eye to see what Lane was driving at, but the small red and green arrows mark the points where momentum showed a shift. These are fair trading signals, and while not infallible, can provide excellent information for a trader who can read them in real time.
The current chart shows that we may be observing a momentum shift from bearish to bullish price action right now. Those investors who have piled in and doubled down for the next upward move can only hope that Lane knew what he was talking about.
—
Originally posted 24th March 2025
For specific platform feedback and suggestions, please submit it directly to our team using these instructions.
If you have an account-specific question or concern, please reach out to Client Services.
We encourage you to look through our FAQs before posting. Your question may already be covered!
Investopedia.com: The comments, opinions and analyses expressed herein are for informational purposes only and should not be considered individual investment advice or recommendations to invest in any security or to adopt any investment strategy. While we believe the information provided herein is reliable, we do not warrant its accuracy or completeness. The views and strategies described on our content may not be suitable for all investors. Because market and economic conditions are subject to rapid change, all comments, opinions and analyses contained within our content are rendered as of the date of the posting and may change without notice. The material is not intended as a complete analysis of every material fact regarding any country, region, market, industry, investment or strategy. This information is intended for US residents only.
Information posted on IBKR Campus that is provided by third-parties does NOT constitute a recommendation that you should contract for the services of that third party. Third-party participants who contribute to IBKR Campus are independent of Interactive Brokers and Interactive Brokers does not make any representations or warranties concerning the services offered, their past or future performance, or the accuracy of the information provided by the third party. Past performance is no guarantee of future results.
This material is from Investopedia and is being posted with its permission. The views expressed in this material are solely those of the author and/or Investopedia and Interactive Brokers is not endorsing or recommending any investment or trading discussed in the material. This material is not and should not be construed as an offer to buy or sell any security. It should not be construed as research or investment advice or a recommendation to buy, sell or hold any security or commodity. This material does not and is not intended to take into account the particular financial conditions, investment objectives or requirements of individual customers. Before acting on this material, you should consider whether it is suitable for your particular circumstances and, as necessary, seek professional advice.
Any discussion or mention of an ETF is not to be construed as recommendation, promotion or solicitation. All investors should review and consider associated investment risks, charges and expenses of the investment company or fund prior to investing. Before acting on this material, you should consider whether it is suitable for your particular circumstances and, as necessary, seek professional advice.
Las opciones implican riesgos y no son adecuadas para todos los inversionistas. Para obtener más información, lea las "Características y riesgos de las opciones estandarizadas" o ODD, a la que se puede acceder a través del enlace que se encuentra en la página de descripción del podcast.
Related Articles

 for Daily Seasonal Data")


Is the ATR on the VIX or is it on the difference between XLU and SPY?
Hello, thank you for reaching out. You can review all our available Products and Exchanges on our webpage: https://spr.ly/IBKR_ProductsExchangesCampus
We hope this helps!