
- Solve real problems with our hands-on interface
- Progress from basic puts and calls to advanced strategies
Interactive Options Course
Posted March 27, 2025 at 10:57 am
1/ The Weekly Chart Looks Weak-ER
2/ Evening Star Flashes on SPX Daily
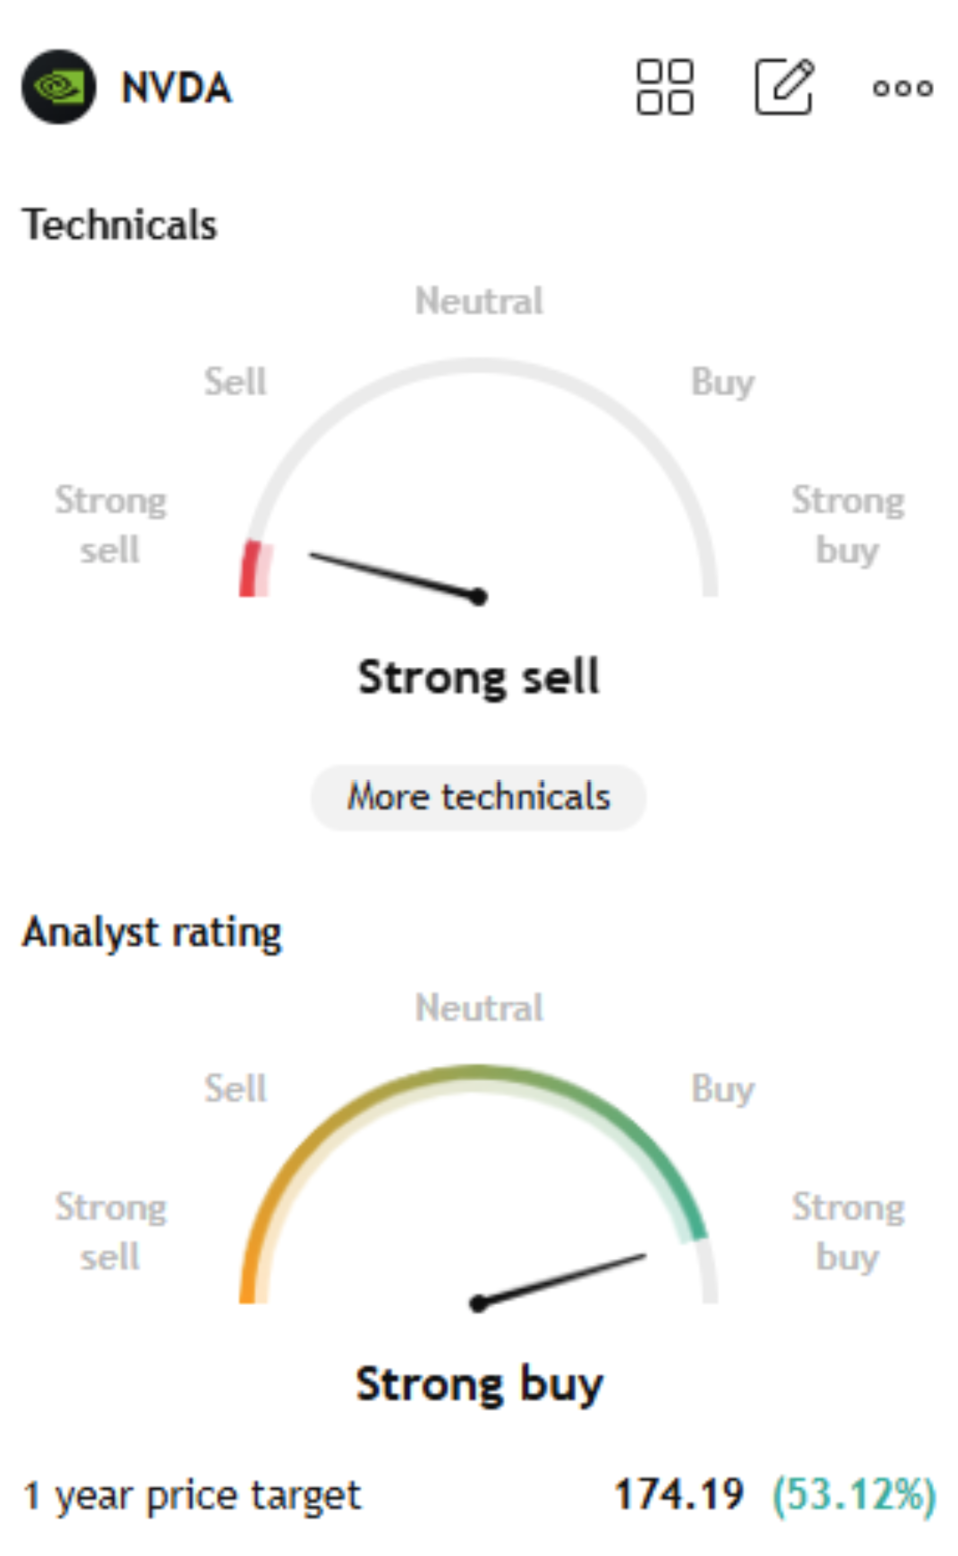
3/ The Nvidia Bellwether
Investopedia is partnering with CMT Association on this newsletter. The contents of this newsletter are for informational and educational purposes only, however, and do not constitute investing advice. The guest authors, which may sell research to investors, and may trade or hold positions in securities mentioned herein do not represent the views of CMT Association or Investopedia. Please consult a financial advisor for investment recommendations and services.
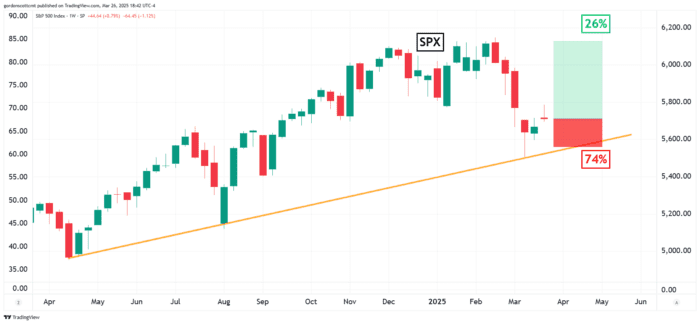
The Weekly Chart Looks Weak-ER
Since I pointed out yesterday that the probability of the S&P 500 index (SPX) breaking its year-long upward trend was greater than the probability that it would resume its upward trend, I thought I’d revisit that weekly chart with updated numbers. Spoiler alert, they didn’t get better.

The markets followed NVDA lower (gee, who mentioned that idea?), after news broke that China could tighten AI regulations sending NVDA shares south with the market in tow. The probability now that in three weeks or less SPX could break its trendline jumped from 61% yesterday to an alarming 74% today.
By the way, here’s a quick chart that tells you all you need to know about the various forms of analysis available to investors and what they will tell you about NVDA stock. (Just sayin’ it. I know you’re all thinkin’ it!)
Evening Star flashes on SPX Daily
I don’t usually place a high degree of importance on candlestick patterns and what they indicate for the overall market, but today’s evening star formation on SPX is an exception. This three candle pattern is a textbook example of what could be a short-term bullish-to-bearish reversal signal.
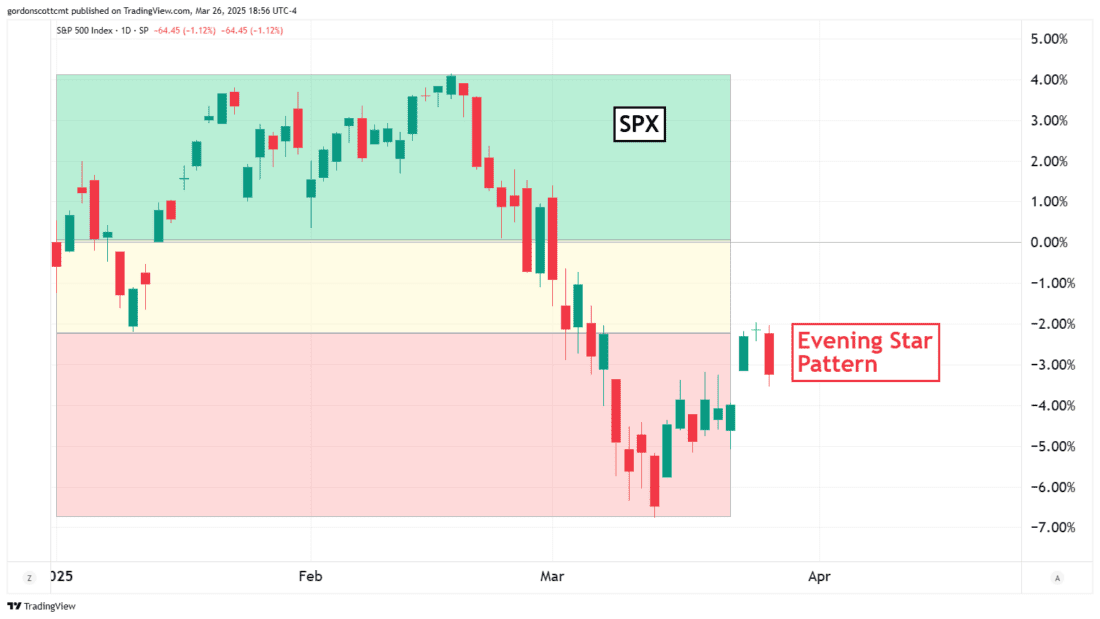
Tom Bulkowski’s extensive research on all things price patterns actually has positive things to say about the utility of this pattern. In particular he points out that his backtesting suggests that it signals a reversal 71% of the time, and that the price leads to a drop between two to six percent within 10 days. A drop that far and that fast could easily break the one-year trendline mentioned previously.
But What the VIX Says…
But not everything you look at indicates bearishness out there. In fact one glaring exception is the Volatility Index (VIX) which seems to give a strong indication that the markets should resume the strong upward swing they started.
To illustrate this indication I have created a chart that turns the VIX upside down. (You can do this by charting 1-VIX in TradingView or other platforms that allow it.) Then I scaled the inverted VIX and the SPX to look similar through 2025, and placed the VIX on top and SPX below.
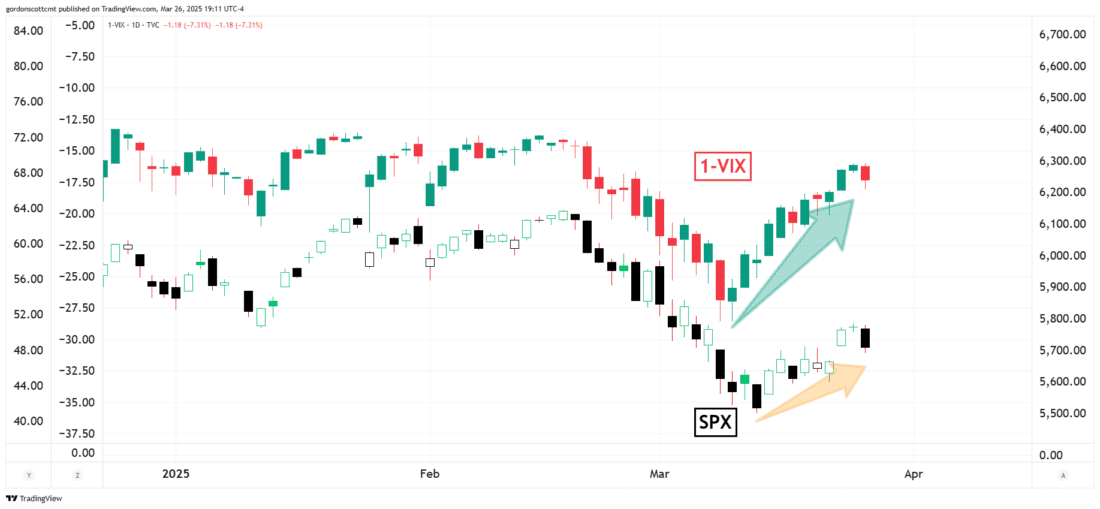
In theory they should look nearly identical since the VIX is so often inversely correlated with SPX. Up until about three weeks ago they did appear similar, but since then the inverted VIX has rapidly increased, leaving SPX lagging behind. Between the two of these something has to change and usually it is SPX following the VIX. That said, it is never a sure thing where option sellers are concerned and this may be just a pre-earnings anomaly, but I would be remiss if I only gave the bearish perspective and didn’t bring this up. It is actually a very bullish indication for now.
—
Originally posted 27th March 2025
Investopedia.com: The comments, opinions and analyses expressed herein are for informational purposes only and should not be considered individual investment advice or recommendations to invest in any security or to adopt any investment strategy. While we believe the information provided herein is reliable, we do not warrant its accuracy or completeness. The views and strategies described on our content may not be suitable for all investors. Because market and economic conditions are subject to rapid change, all comments, opinions and analyses contained within our content are rendered as of the date of the posting and may change without notice. The material is not intended as a complete analysis of every material fact regarding any country, region, market, industry, investment or strategy. This information is intended for US residents only.
Information posted on IBKR Campus that is provided by third-parties does NOT constitute a recommendation that you should contract for the services of that third party. Third-party participants who contribute to IBKR Campus are independent of Interactive Brokers and Interactive Brokers does not make any representations or warranties concerning the services offered, their past or future performance, or the accuracy of the information provided by the third party. Past performance is no guarantee of future results.
This material is from Investopedia and is being posted with its permission. The views expressed in this material are solely those of the author and/or Investopedia and Interactive Brokers is not endorsing or recommending any investment or trading discussed in the material. This material is not and should not be construed as an offer to buy or sell any security. It should not be construed as research or investment advice or a recommendation to buy, sell or hold any security or commodity. This material does not and is not intended to take into account the particular financial conditions, investment objectives or requirements of individual customers. Before acting on this material, you should consider whether it is suitable for your particular circumstances and, as necessary, seek professional advice.
Related Articles


")
Join The Conversation
For specific platform feedback and suggestions, please submit it directly to our team using these instructions.
If you have an account-specific question or concern, please reach out to Client Services.
We encourage you to look through our FAQs before posting. Your question may already be covered!