1/ Quadrant Crossover in CITIGROUP, Inc (C)
2/ Fresh 52-Week Highs
3/ Relative Strength in a Strong Uptrend
4/ Golden Cross
Investopedia is partnering with CMT Association on this newsletter. The contents of this newsletter are for informational and educational purposes only, however, and do not constitute investing advice. The guest authors, which may sell research to investors, and may trade or hold positions in securities mentioned herein do not represent the views of CMT Association or Investopedia. Please consult a financial advisor for investment recommendations and services.
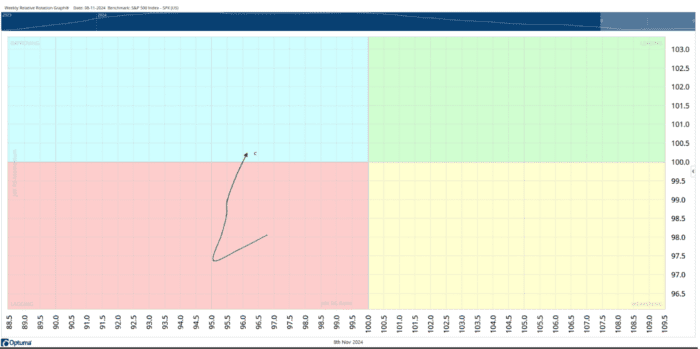
1/
Quadrant Crossover in CITIGROUP, Inc (C)
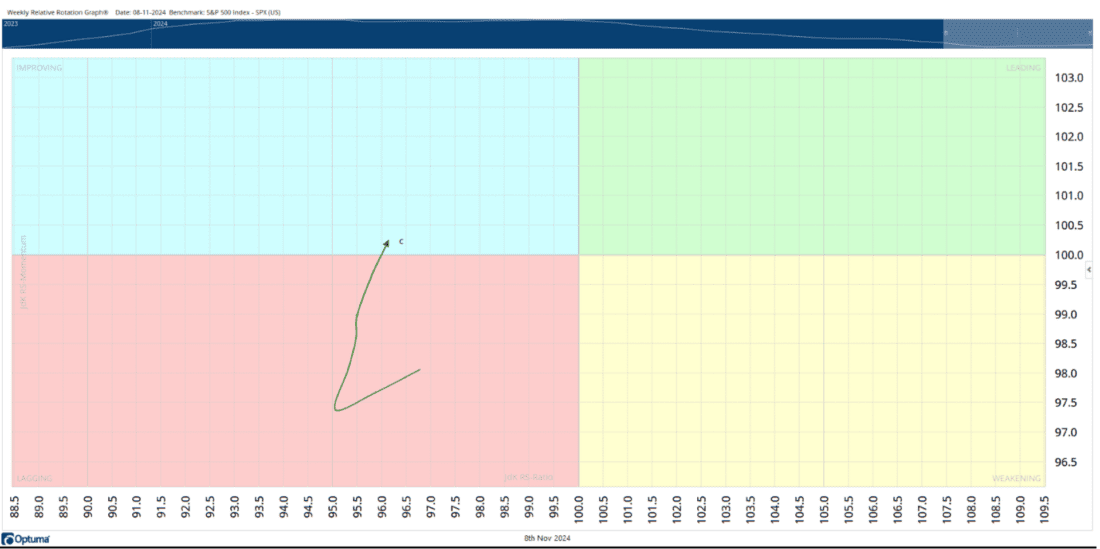
Courtesy of Optuma
Quadrant crossovers in Relative Rotation Graphs (RRG) are critical for identifying shifts in relative strength, particularly when tracking a security’s performance against a benchmark, like the SPX. Citigroup, Inc. (C) has recently crossed into the improving quadrant on the RRG, signaling a possible start of a phase of relative outperformance. This movement suggests an improvement in Citigroup’s momentum and relative strength compared to the broader market. Such crossovers are often indicative of a stock transitioning from a weaker phase to a stronger one, where it may outperform in the near term. Investors and analysts closely monitor these shifts, as they offer early insight into emerging trends and help identify potential opportunities.
2/
Fresh 52-week Highs
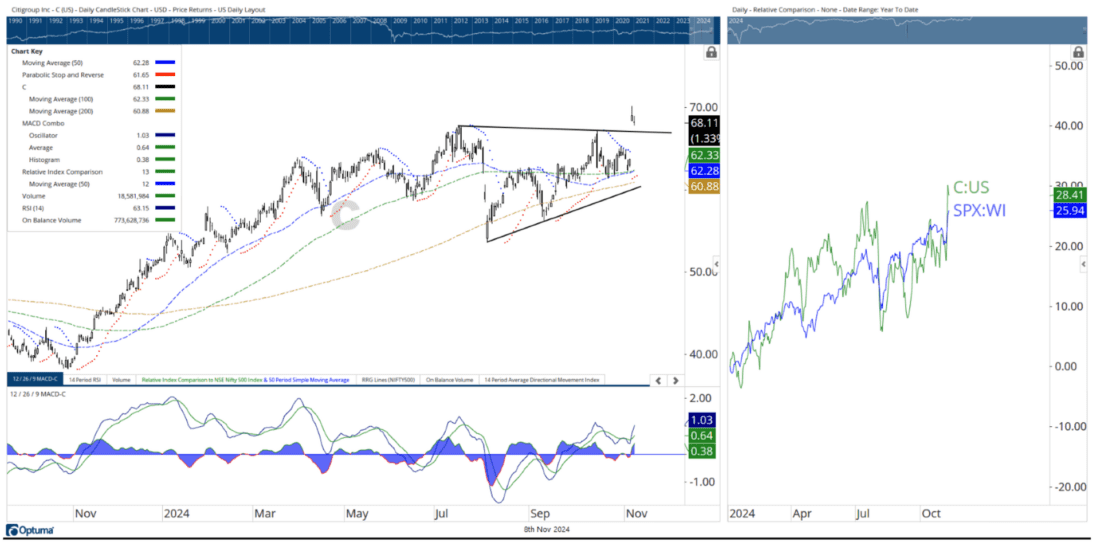
Courtesy of Optuma
Over recent months, Citigroup (C) has demonstrated strong outperformance relative to the broad SPX index. Year-to-date, Citigroup has returned 28.41%, closely matching the SPX’s gain of 25.94%. The stock recently achieved a fresh 52-week high, driven by a breakout accompanied by significantly higher-than-average trading volumes. This volume-backed breakout indicates strong buying interest, supporting the stock’s upward momentum. On the Relative Rotation Graph (RRG), Citigroup has positioned itself within the leading quadrant, signaling the likelihood of sustained relative outperformance against the broader market. This technical strength suggests a favorable outlook, as it reflects both relative strength and momentum in Citigroup’s favor, making it an appealing candidate for continued performance in the weeks ahead.
3/
Relative Strength in a Strong Uptrend
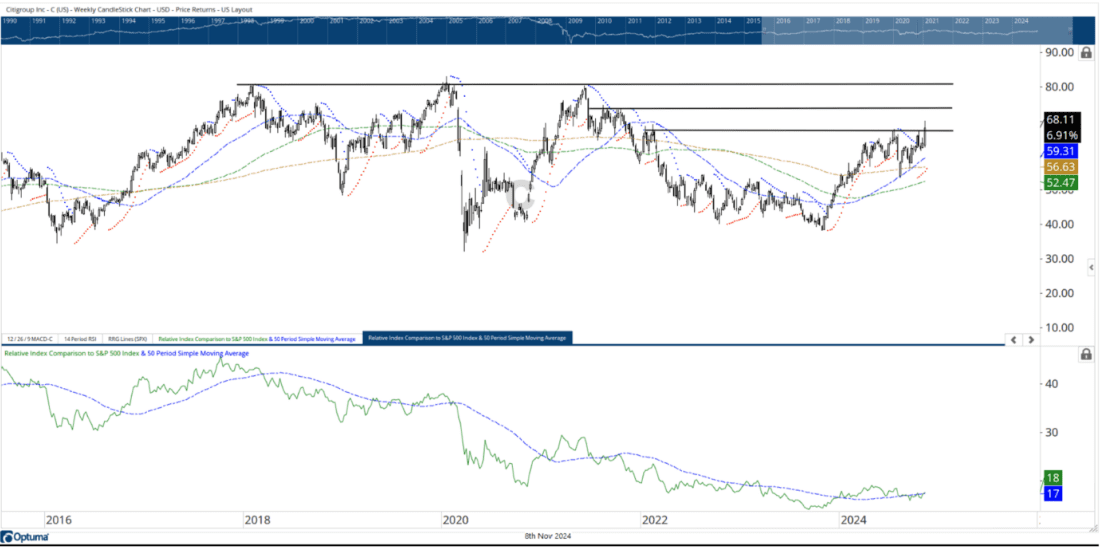
Courtesy of Optuma
The weekly chart for Citigroup presents an optimistic technical outlook. The Relative Strength (RS) line on the daily chart is near its highs, while on the weekly chart, it is reversing upwards, indicating strengthening relative performance. The recent price close above the upper Bollinger Band suggests a potential emerging trend, as such moves often signal the beginning of sustained momentum. Additionally, the weekly MACD has shown a fresh positive crossover, now positioned above its signal line, reinforcing the bullish sentiment. The Relative Strength Index (RSI) has also reached a new 14-period high, further supporting a positive trajectory and hinting at continued strength in the coming weeks. These indicators collectively point to a favorable trend for Citigroup.
4/
Golden Cross
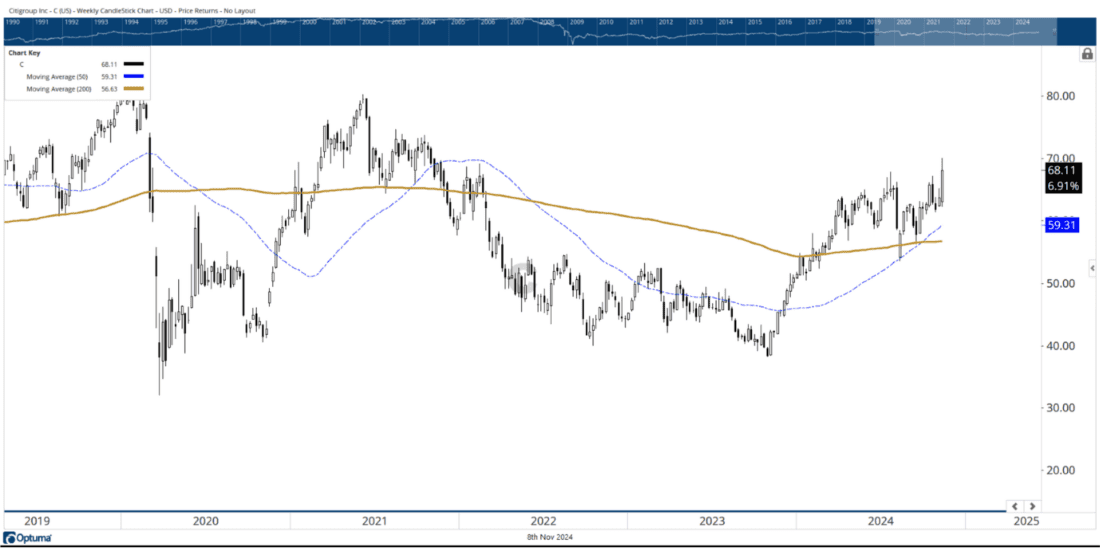
Courtesy of Optuma
A golden cross is a significant bullish signal indicating a shift in momentum. On Citigroup’s weekly chart, a golden crossover has appeared as the 50-week moving average crossed above the 100-week moving average. This formation suggests a transition from a prior downtrend to a potential long-term uptrend, signaling increased buying interest and confidence in the stock’s outlook. The golden cross is often seen as a reliable indicator of sustained strength, as it reflects a positive shift in price momentum over time. Investors interpret this signal as a promising entry point, as it historically aligns with periods of extended upward movement.
Citigroup currently presents an attractive entry opportunity for medium-term investors. While some consolidation or minor retracement may occur, the stock holds strong potential for testing the $73 level, with a possible extension toward $80 in the coming weeks. This target is supported by recent technical strength and favorable momentum indicators, which suggest the likelihood of continued upward movement. However, a close below the $60 level would invalidate this setup, signaling a potential shift in trend and warranting a reassessment of the position. Investors should monitor price action closely to ensure alignment with the projected bullish trajectory.
—
Originally posted 8th November 2024
Disclosure: Investopedia
Investopedia.com: The comments, opinions and analyses expressed herein are for informational purposes only and should not be considered individual investment advice or recommendations to invest in any security or to adopt any investment strategy. While we believe the information provided herein is reliable, we do not warrant its accuracy or completeness. The views and strategies described on our content may not be suitable for all investors. Because market and economic conditions are subject to rapid change, all comments, opinions and analyses contained within our content are rendered as of the date of the posting and may change without notice. The material is not intended as a complete analysis of every material fact regarding any country, region, market, industry, investment or strategy. This information is intended for US residents only.
Disclosure: Interactive Brokers Third Party
Information posted on IBKR Campus that is provided by third-parties does NOT constitute a recommendation that you should contract for the services of that third party. Third-party participants who contribute to IBKR Campus are independent of Interactive Brokers and Interactive Brokers does not make any representations or warranties concerning the services offered, their past or future performance, or the accuracy of the information provided by the third party. Past performance is no guarantee of future results.
This material is from Investopedia and is being posted with its permission. The views expressed in this material are solely those of the author and/or Investopedia and Interactive Brokers is not endorsing or recommending any investment or trading discussed in the material. This material is not and should not be construed as an offer to buy or sell any security. It should not be construed as research or investment advice or a recommendation to buy, sell or hold any security or commodity. This material does not and is not intended to take into account the particular financial conditions, investment objectives or requirements of individual customers. Before acting on this material, you should consider whether it is suitable for your particular circumstances and, as necessary, seek professional advice.




Join The Conversation
For specific platform feedback and suggestions, please submit it directly to our team using these instructions.
If you have an account-specific question or concern, please reach out to Client Services.
We encourage you to look through our FAQs before posting. Your question may already be covered!