By Fadi Dawood
1/ MicroStrategy ($MSTR): Signs of Exhaustion?
2/ Gold Futures: Lower High in Play?
Investopedia is partnering with CMT Association on this newsletter. The contents of this newsletter are for informational and educational purposes only, however, and do not constitute investing advice. The guest authors, which may sell research to investors, and may trade or hold positions in securities mentioned herein do not represent the views of CMT Association or Investopedia. Please consult a financial advisor for investment recommendations and services.
1/
MicroStrategy ($MSTR): Signs of Exhaustion?
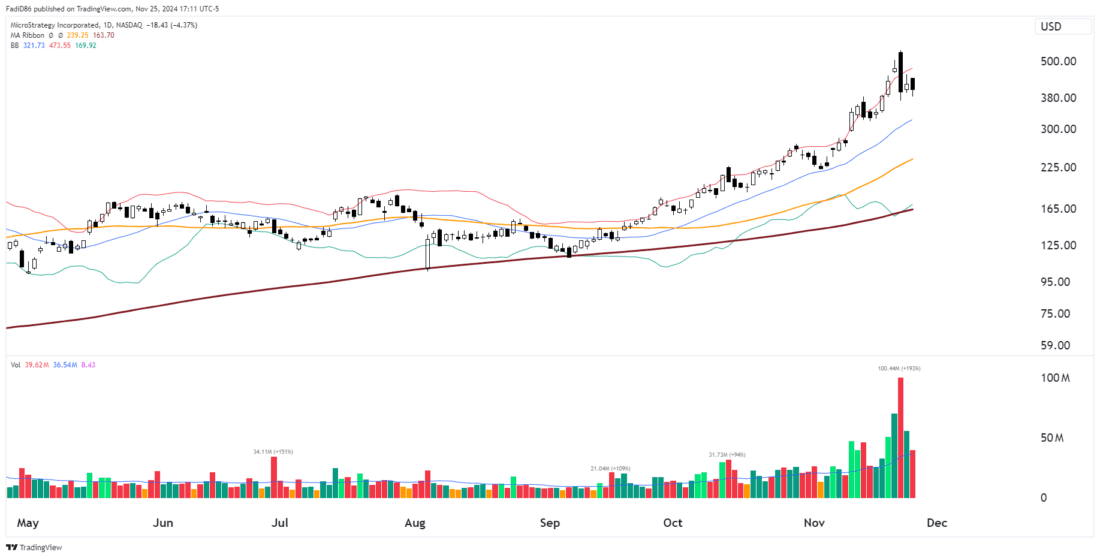
MicroStrategy ($MSTR) has experienced a powerful rally, surging to new highs, but recent price action suggests the stock might be showing signs of exhaustion.
MSTR remains firmly in an uptrend, trading well above its 200-day SMA (thick maroon line), which continues to rise. The 50-day SMA (orange) and 20-day SMA (blue) are also trending upward, providing shorter-term support. However, the recent pullback from the upper Bollinger Band indicates that momentum may be cooling off, at least temporarily.

The stock recently hit a high near $540 before retreating, leaving behind a series of volatile daily candles with long upper wicks. This pattern often signals hesitation or profit-taking among buyers. Prices are now consolidating near a support level between $370-$375. A break below this level could lead to further downside.
The recent surge in volume, particularly during the rally to $540, suggests heightened trading activity driven by both buyers and sellers. While strong volume is generally a positive sign, the accompanying pullback indicates that profit-taking is in play. If volume spikes on down days persist, it could signal distribution and further selling pressure.
2/
Gold Futures: Lower High in Play?
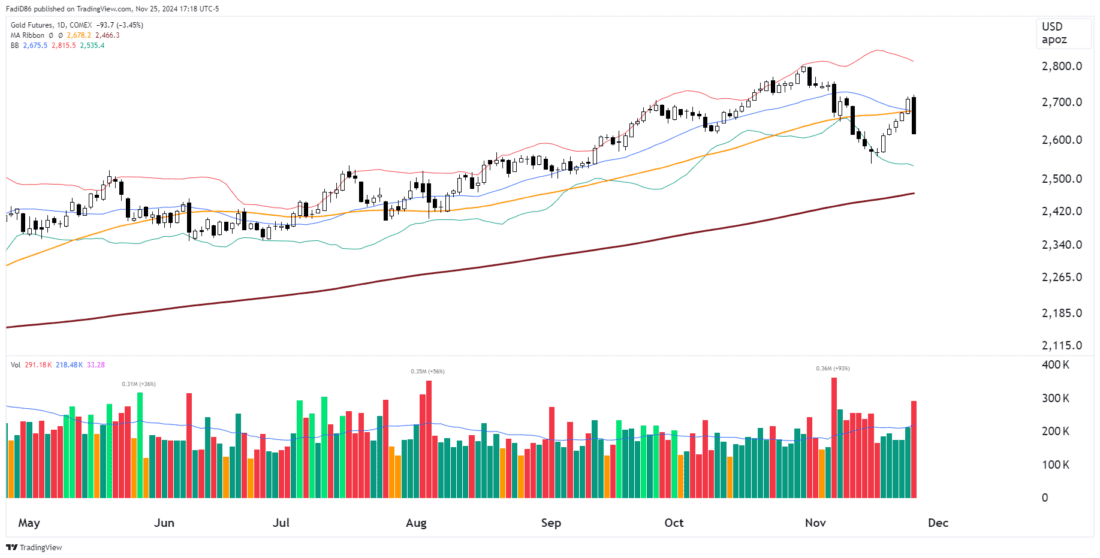
Gold Futures appear to have printed a lower high, signaling potential weakness in the recent rally. After a strong rebound from support levels, price action suggests that bullish momentum may be losing steam, with a rejection near prior highs.
The chart shows Gold Futures rallying above the 200-day SMA (thick maroon line) in early November, climbing back above the 20-day SMA (blue) and 50-day SMA (orange). However, the rally stalled creating a potential lower high. This failure to break into new highs suggests a shift in momentum and could be an early indication of a bearish trend reversal.

While Gold remains above the 200-day SMA, which continues to rise, the shorter-term moving averages are showing signs of flattening. The recent drop below the 20-day SMA ($2,675) reflects fading bullish momentum. A sustained move below the 50-day SMA ($2,678) would confirm the weakening trend and raise the likelihood of a deeper retracement.
Volume surged during the pullback from the recent high, signaling significant selling interest. This contrasts with the moderate volume seen during the rally, suggesting that sellers are regaining control. A continuation of high-volume selling could amplify bearish pressure.
—
Originally posted 26th November 2024
Disclosure: Investopedia
Investopedia.com: The comments, opinions and analyses expressed herein are for informational purposes only and should not be considered individual investment advice or recommendations to invest in any security or to adopt any investment strategy. While we believe the information provided herein is reliable, we do not warrant its accuracy or completeness. The views and strategies described on our content may not be suitable for all investors. Because market and economic conditions are subject to rapid change, all comments, opinions and analyses contained within our content are rendered as of the date of the posting and may change without notice. The material is not intended as a complete analysis of every material fact regarding any country, region, market, industry, investment or strategy. This information is intended for US residents only.
Disclosure: Interactive Brokers Third Party
Information posted on IBKR Campus that is provided by third-parties does NOT constitute a recommendation that you should contract for the services of that third party. Third-party participants who contribute to IBKR Campus are independent of Interactive Brokers and Interactive Brokers does not make any representations or warranties concerning the services offered, their past or future performance, or the accuracy of the information provided by the third party. Past performance is no guarantee of future results.
This material is from Investopedia and is being posted with its permission. The views expressed in this material are solely those of the author and/or Investopedia and Interactive Brokers is not endorsing or recommending any investment or trading discussed in the material. This material is not and should not be construed as an offer to buy or sell any security. It should not be construed as research or investment advice or a recommendation to buy, sell or hold any security or commodity. This material does not and is not intended to take into account the particular financial conditions, investment objectives or requirements of individual customers. Before acting on this material, you should consider whether it is suitable for your particular circumstances and, as necessary, seek professional advice.
Disclosure: Futures Trading
Futures are not suitable for all investors. The amount you may lose may be greater than your initial investment. Before trading futures, please read the CFTC Risk Disclosure. A copy and additional information are available at ibkr.com.


Join The Conversation
For specific platform feedback and suggestions, please submit it directly to our team using these instructions.
If you have an account-specific question or concern, please reach out to Client Services.
We encourage you to look through our FAQs before posting. Your question may already be covered!