
- Solve real problems with our hands-on interface
- Progress from basic puts and calls to advanced strategies
Interactive Options Course
Posted May 30, 2024 at 10:44 am
By Alex Cole
1/ $USCI: U.S. Commodities Index Enters “Go” Trend
2/ GoNoGo Commodities RelMap
3/ Copper: A Base Metal
4/ Silver: A Precious Metal
Investopedia is partnering with CMT Association on this newsletter. The contents of this newsletter are for informational and educational purposes only, however, and do not constitute investing advice. The guest authors, which may sell research to investors, and may trade or hold positions in securities mentioned herein do not represent the views of CMT Association or Investopedia. Please consult a financial advisor for investment recommendations and services.
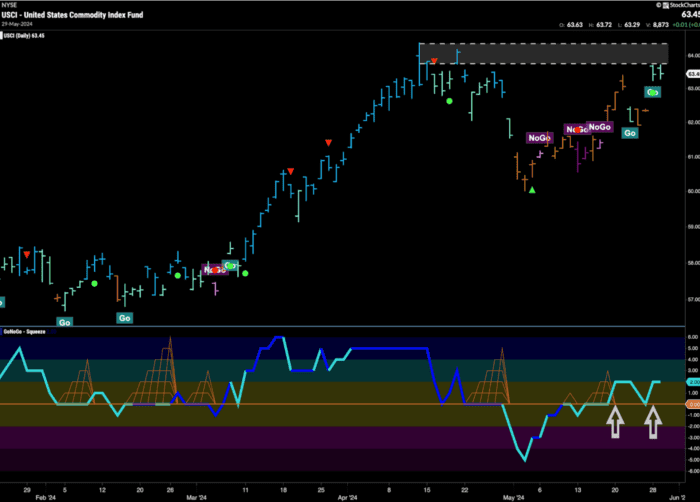
$USCI: U.S. Commodities Index Enters “Go” Trend
Yesterday we took a broad look across the asset classes to assess the technical environment in terms of trend, momentum, volume, and volatility. Today, we’ll dive a little deeper into the commodities space, and use GoNoGo methodology and new relative strength visualizations to look for leadership. The chart below shows the U.S. Commodities Index fund, $USCI, and we’ll use our three questions from yesterday to give ourselves a robust overview of the technical analysis.

Courtesy of StockCharts
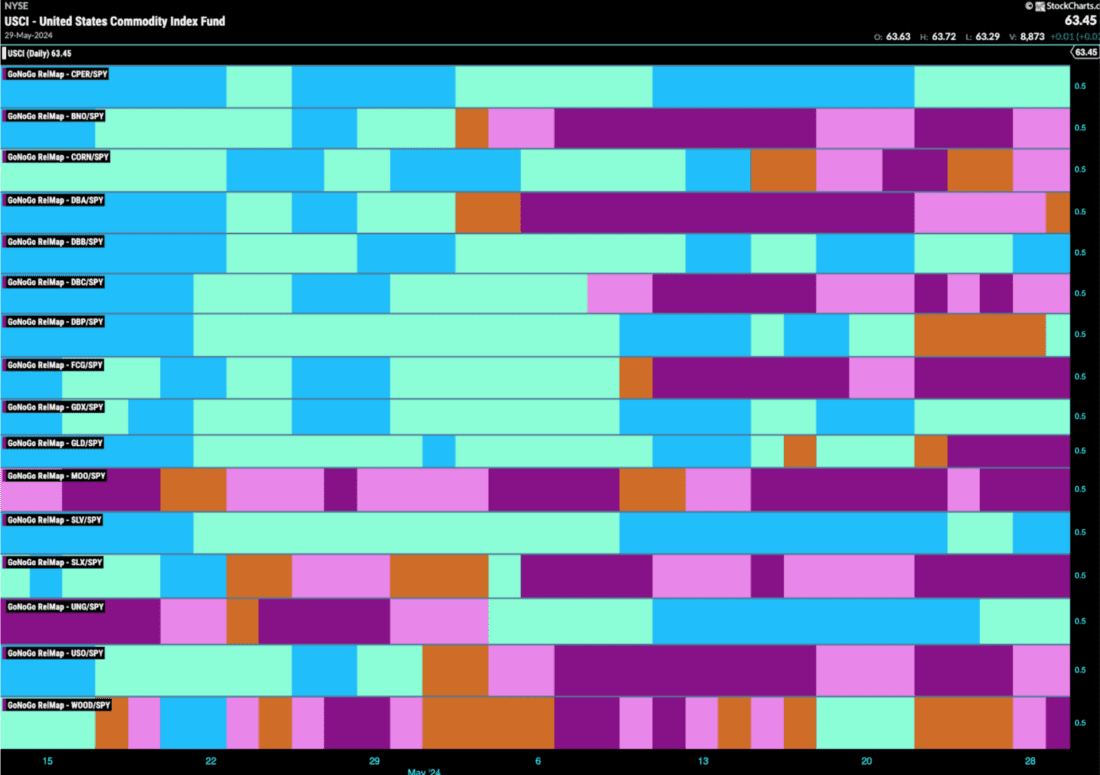
GoNoGo Commodities RelMap
Relative strength is an incredibly powerful concept in the study of technical analysis and price action. It allows the investor to generate alpha, by investing in areas of the market that are outperforming, and staying away from those that are underperforming. The GoNoGo Commodities RelMap below applies the GoNoGo Trend methodology to several relative strength ratios and plots the trend colors in a panel with no regard for price action. This allows us to focus on the trend itself and uncover areas of leadership.
Courtesy of StockCharts
What we can see clearly is that when looking at a broad spectrum of commodities relative to the larger equity index, the leadership (blue and aqua panels) is coming from a select few areas. With the exception of natural gas (in a relative “Go” trend in the third panel from bottom) all of the other panels painting blue and aqua relative “Go” colors are base and precious metals.
Copper: A Base Metal
Given what we discovered above, we’ll look at copper, a base metal, and use the GoNoGo Chart to give us a complete understanding of the technical environment. We can see that $CPER, the copper fund, has been in a “Go” trend since February of this year and has made a series of higher highs and higher lows. Below, we’ll answer our three questions.

Courtesy of StockCharts
Silver: A Precious Metal
The metals are helping drive the commodity index higher and precious metals are playing their part. Below is a chart of $SLV, the silver fund, with the full suite of GoNoGo tools applied. After entering the “Go” trend at the beginning of March, price has made a series of higher highs and higher lows. We can see that as price fell from its most recent high, it found prior high support. This kind of traditional technical analysis is easy on a GoNoGo chart because there is nothing else on the chart distracting us from focusing on price movements. On to our three questions.

Courtesy of StockCharts
—
Originally posted 30th May 2024
Investopedia.com: The comments, opinions and analyses expressed herein are for informational purposes only and should not be considered individual investment advice or recommendations to invest in any security or to adopt any investment strategy. While we believe the information provided herein is reliable, we do not warrant its accuracy or completeness. The views and strategies described on our content may not be suitable for all investors. Because market and economic conditions are subject to rapid change, all comments, opinions and analyses contained within our content are rendered as of the date of the posting and may change without notice. The material is not intended as a complete analysis of every material fact regarding any country, region, market, industry, investment or strategy. This information is intended for US residents only.
Information posted on IBKR Campus that is provided by third-parties does NOT constitute a recommendation that you should contract for the services of that third party. Third-party participants who contribute to IBKR Campus are independent of Interactive Brokers and Interactive Brokers does not make any representations or warranties concerning the services offered, their past or future performance, or the accuracy of the information provided by the third party. Past performance is no guarantee of future results.
This material is from Investopedia and is being posted with its permission. The views expressed in this material are solely those of the author and/or Investopedia and Interactive Brokers is not endorsing or recommending any investment or trading discussed in the material. This material is not and should not be construed as an offer to buy or sell any security. It should not be construed as research or investment advice or a recommendation to buy, sell or hold any security or commodity. This material does not and is not intended to take into account the particular financial conditions, investment objectives or requirements of individual customers. Before acting on this material, you should consider whether it is suitable for your particular circumstances and, as necessary, seek professional advice.
Related Articles


Join The Conversation
For specific platform feedback and suggestions, please submit it directly to our team using these instructions.
If you have an account-specific question or concern, please reach out to Client Services.
We encourage you to look through our FAQs before posting. Your question may already be covered!