1/ S&P 500 and FOMC Meetings
2/ Effective Fed Funds Rate & 10-Year Yield
3/ MAGS Magnificent Seven ETF
Investopedia is partnering with CMT Association on this newsletter. The contents of this newsletter are for informational and educational purposes only, however, and do not constitute investing advice. The guest authors, which may sell research to investors, and may trade or hold positions in securities mentioned herein do not represent the views of CMT Association or Investopedia. Please consult a financial advisor for investment recommendations and services.
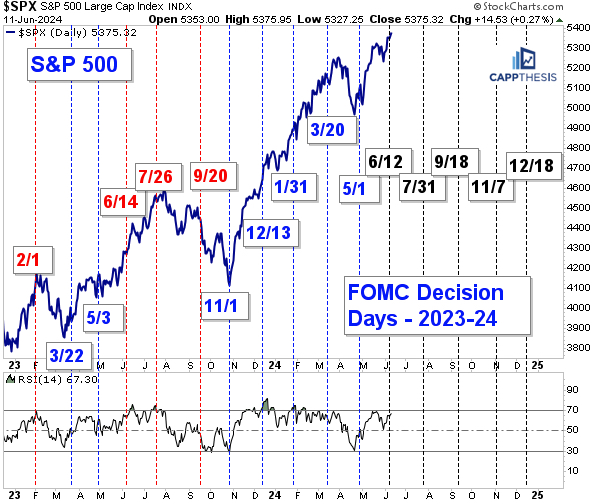
1/ S&P 500 and FOMC Meetings
Today marks the FOMC’s sixth interest rate decision since the October’23 market low. Unlike traditional economic data reports that get released monthly, the FOMC meets every six weeks – unless extreme circumstances prompt unplanned emergency actions, which we last saw in March 2020 during the COVID-induced market crash. A lot can happen over a six-week period, but this allows the Fed to view all of the economic reports in aggregate, rather than letting one data point dictate (or change) their stance.
However, the stock market typically sniffs out the underlying themes much more quickly. We’re not talking about the volatile two hours from 2:00 – 4:00 on Fed Day. We’re referring to the two weeks of trading following the decision. That’s when we really find out what politicians, economists and, most importantly, traders think of the FOMC’s plans. Traders’ collective stance is then reflected in the stock market’s direction, which is why we need to play close attention.
On this chart we show each FOMC decision day in 2023 and 2024. The dates colored in red depict when the S&P 500 was lower two weeks later. The dates in blue show when the index was higher two weeks later. As is quite clear, the SPX has been higher two weeks later five straight times. While this isn’t surprising given the market’s uptrend since then, it has shown exactly how the market has felt about the FOMC and its projected interest rate path up to this point.
Translation – when the trend of performing well two weeks after the Fed decision turns negative, the market’s uptrend could be in jeopardy, as well. But not before.

2/ Effective Fed Funds Rate & 10-Year Yield
The FOMC claims it is data dependent, and we should believe them. If CPI spikes and continues to move higher in the months to come, the Fed will have a difficult time justifying cutting rates. The opposite also is true, but as just discussed, the committee takes its time in changing policy given the whipsaws in monthly data.
Thus, the FOMC is paying just as much attention – if not more – to the 10-Year Yield for guidance and rightly so. The 10-Year Yield IS the gauge for the Fed’s self-proclaimed duel mandate of keeping inflation in check and keeping the economy in good shape. If bond traders think inflation is headed lower, they’ll put their investment thesis to work. And if bond prices go up, interest rates go down. If lower rates become a trend, the Effective Federal Funds Rate will begin to lag. And if the gap between the two widens enough, the Fed eventually will need to act.
This happened in 2018 as the 10-Year Yield crested and then rolled over – before and then after COVID. The reverse happened from 2020 through 2022, of course, as the 10-Year rose for nearly two years before the Fed threw in the towel. They then played catch up in historic fashion.
Currently, even though the 10-Year is off its highs from late 2023, it has stayed relatively buoyant. This has influenced the FOMC to keep rates steady for now instead of cutting. When will this change? When the 10-Yield Year moves a lot more than it has over the last six months.

3/ MAGS Magnificent Seven ETF
The MAGS ETF made a new all-time high yesterday – both in absolute and relative terms vs. the SPX. This is bullish, however, each prior breakout to new highs since May’23 eventually was undercut – sometimes by a lot, sometimes marginally. None of those proved to be major turning points, of course, with MAGS routinely being bought on weakness. Nevertheless, this shouldn’t be ignored even with the ETF now noticeably above its last breakout point. Translation – we could see a pullback back to, or under, the last breakout soon. Indeed, MAGS is higher now than at any point in its history. Thus, from this perspective, buying it any time prior to now ended up being a good play. However, buying the dip has provided a better risk-reward scenario. This is very important for traders to recognize.
MAGS vs. SPX As the bottom panel of this chart shows, the MAGS/SPX relative line is at a new all-time high and now visibly is above the trading channel that had confined its price action since the ETF’s inception. New highs in this line have been faded, too, in its brief history. The odds are high that this happens again at some point in the near future, as well.

About this week’s author
Frank Cappelleri, CMT, CFA has been an active member of the CMT Association for over 20 years and received his CMT Charter in 2004. Frank had various roles during his 25-year Wall Street career, including equity sales trader, technical analyst, research sales specialist and desk strategist.
——–
Originally posted on June 12th, 2024
Disclosure: Investopedia
Investopedia.com: The comments, opinions and analyses expressed herein are for informational purposes only and should not be considered individual investment advice or recommendations to invest in any security or to adopt any investment strategy. While we believe the information provided herein is reliable, we do not warrant its accuracy or completeness. The views and strategies described on our content may not be suitable for all investors. Because market and economic conditions are subject to rapid change, all comments, opinions and analyses contained within our content are rendered as of the date of the posting and may change without notice. The material is not intended as a complete analysis of every material fact regarding any country, region, market, industry, investment or strategy. This information is intended for US residents only.
Disclosure: Interactive Brokers Third Party
Information posted on IBKR Campus that is provided by third-parties does NOT constitute a recommendation that you should contract for the services of that third party. Third-party participants who contribute to IBKR Campus are independent of Interactive Brokers and Interactive Brokers does not make any representations or warranties concerning the services offered, their past or future performance, or the accuracy of the information provided by the third party. Past performance is no guarantee of future results.
This material is from Investopedia and is being posted with its permission. The views expressed in this material are solely those of the author and/or Investopedia and Interactive Brokers is not endorsing or recommending any investment or trading discussed in the material. This material is not and should not be construed as an offer to buy or sell any security. It should not be construed as research or investment advice or a recommendation to buy, sell or hold any security or commodity. This material does not and is not intended to take into account the particular financial conditions, investment objectives or requirements of individual customers. Before acting on this material, you should consider whether it is suitable for your particular circumstances and, as necessary, seek professional advice.
Disclosure: ETFs
Any discussion or mention of an ETF is not to be construed as recommendation, promotion or solicitation. All investors should review and consider associated investment risks, charges and expenses of the investment company or fund prior to investing. Before acting on this material, you should consider whether it is suitable for your particular circumstances and, as necessary, seek professional advice.


Join The Conversation
For specific platform feedback and suggestions, please submit it directly to our team using these instructions.
If you have an account-specific question or concern, please reach out to Client Services.
We encourage you to look through our FAQs before posting. Your question may already be covered!