1/ Gold Hits Record Highs
2/ Gold Miners Lag Behind Physical Gold
3/ China Market Stagnates, Lacks Momentum
4/ Semiconductors, the Critical Market Driver
Investopedia is partnering with CMT Association on this newsletter. The contents of this newsletter are for informational and educational purposes only, however, and do not constitute investing advice. The guest authors, which may sell research to investors, and may trade or hold positions in securities mentioned herein do not represent the views of CMT Association or Investopedia. Please consult a financial advisor for investment recommendations and services.
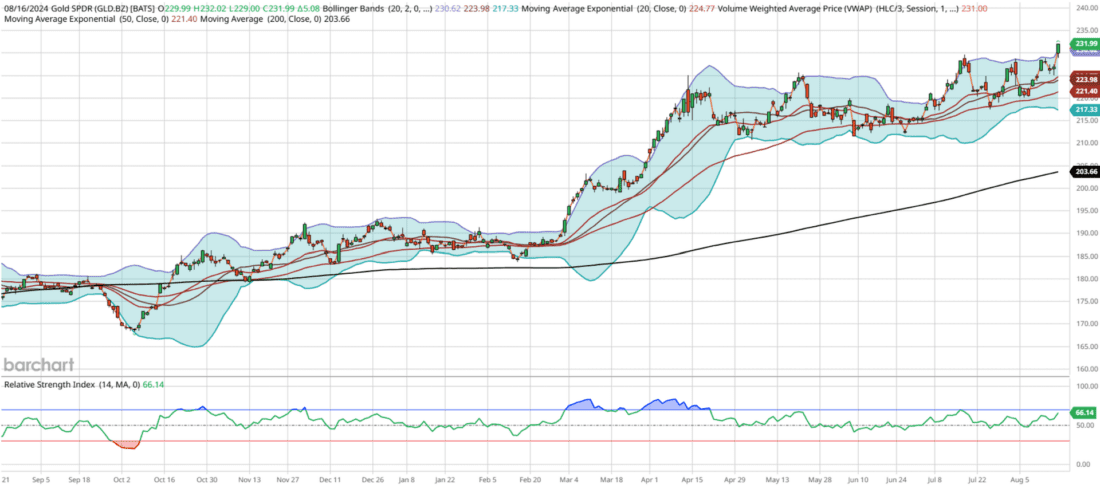
1/ Gold Hits Record Highs

Courtesy of barchart
Gold (GLD) has become the favored asset in the current market, achieving new all-time highs on Friday. Meanwhile, the S&P 500 is approaching its own record high, just shy of 2%, as it continues to recover from the Japan crash on August 5th. Gold’s technical indicators remain robust, having finally broken out of its four-month, 8.5% range of $211-$229. It has maintained a steadily rising 200-day moving average, which has picked up momentum since its Relative Strength Index (RSI) Indicator first crossed 75 in March, signaling a breakout above $193.
Throughout the year, gold has consistently attracted investor dollars, seldom dipping below a 50 RSI, a characteristic of strong assets with a high-performance profile. Current support lies at the 200-day moving average of $204, about 12% lower than its present level. Recently, gold tends to break out, oscillate within a 7-10% range for about four months, and then break out again.
Looking ahead, I anticipate a brief consolidation period over the next three weeks, with gold likely to stabilize around $225, its 21-day exponential moving average. One factor supporting this expectation is the bearish divergence at the recent all-time high: despite reaching the highest price ever, the RSI failed to exceed 70, whereas I would have preferred to see it surpass 85, as it did in April.
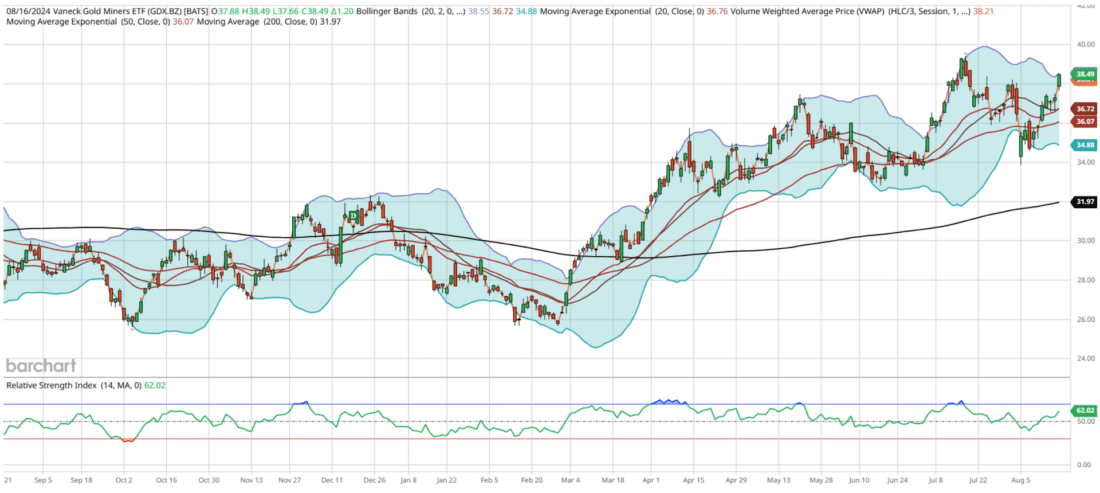
2/ Gold Miners Lag Behind Physical Gold

Courtesy of barchart
Gold miners, while somewhat correlated with gold itself, often trade differently due to their nature as equities competing for investor dollars. These companies face expenses, liabilities, and operational challenges, including the need for exploration and profitability management by their boards of directors.
Examining the chart of the Gold Miners ETF (GDX), it’s notable that it hasn’t reached a new all-time high since September 2011, when it peaked at $67. While GDX continues to attract short-term investment, the substantial government deficit increase is driving more investors towards physical gold, which doesn’t bear the same operational burdens and typically offers more direct exposure.
Despite being just 2% away from new 52-week highs and having a rising 200-day moving average, GDX is technically trading heavier than gold. Since April, GDX has traded above its 200-day moving average, which serves as a support level, and recorded its key overbought RSI readings in the same month. For GDX to make new highs in the coming days or weeks, I’d prefer to see a higher RSI confirmation above 74, as seen on July 17th when it reached its 52-week high of $39.41.
In the short term, GDX may rise to match its 52-week high in the next week before likely consolidating 4-5% over the next three weeks, aligning with its 21-day exponential moving average of $36.74.
3/ China Market Stagnates, Lacks Momentum

Courtesy of barchart
The current chart of China’s market, particularly the FXI, presents an intriguing yet frustrating picture for investors. Despite its prolonged underperformance, FXI has not registered an oversold RSI reading below 30 this year. In fact, it showed overbought readings in May, leading to its 52-week high. Although the 200-day moving average has flatlined at $24.96 and is slightly declining with lower highs, I anticipate that China will remain range-bound unless there is a significant global catalyst or extreme market positioning.
Since the end of April, FXI has held its 200-day moving average as support, but there seems to be insufficient momentum to break above its July high of $27.60. In the near term, I expect a modest upside of about 1% this week, reaching around $26.60, slightly above its upper Bollinger Band due to recent volatility expansion. By early September, I foresee a retracement to $25.70, aligning with its 21-day exponential moving average while still maintaining support at its 200-day moving average.
4/ Semiconductors, the Critical Market Driver

Courtesy of barchart
In my view, the most critical chart in the market right now is SMH, which has emerged as the second-best performer over the past 52 weeks, only trailing behind Bitcoin. The alpha in tech has primarily been driven by well-known giants like Nvidia, the largest component of this fund, and Taiwan Semiconductor, together comprising 35% of the ETF. The performance of SMH often influences QQQ, SPY, and, by extension, your 401(k) and global markets. Thus, it’s essential to monitor this group closely, as they are akin to our generation’s railroads.
Semiconductors peaked on July 11th at $283, exhibiting a bearish divergence by not reaching a 70 RSI, compared to an 81 RSI at slightly lower prices three weeks earlier. During the Japan crash on August 5th, this group traded below its 200-day moving average for just the third time since January 2023. If you recognized the opportunity and bought in on that day, congratulations! Semiconductors haven’t been oversold according to RSI readings since September 2022, highlighting their desirability in the market.
Since the Japan crash, SMH has rallied an impressive 23.5% in just 12 days, averaging nearly 2% per day. Moving forward, if you’re bullish on the market, you’ll want this sector to continue its upward trajectory. My near-term outlook for SMH suggests a modest upside of about 1-3% to reach $250-255 this week. However, I anticipate a period of consolidation, with the ETF likely retracing to around $238, its 21-day exponential moving average, which represents a 3.5% decline over the next three weeks.
About this week’s author
John Salama, CMT, is a Chartered Market Technician since 2021 with over 15 years of institutional derivatives experience. Currently, John is a proprietary trader who systematically utilizes technical analysis. He shares his expertise by broadcasting his trading process three days a week at market close on his YouTube channel, aiming to educate retail traders. He is also a regular interviewee for Business Insider.
——–
Originally posted on August 19th, 2024
Disclosure: Investopedia
Investopedia.com: The comments, opinions and analyses expressed herein are for informational purposes only and should not be considered individual investment advice or recommendations to invest in any security or to adopt any investment strategy. While we believe the information provided herein is reliable, we do not warrant its accuracy or completeness. The views and strategies described on our content may not be suitable for all investors. Because market and economic conditions are subject to rapid change, all comments, opinions and analyses contained within our content are rendered as of the date of the posting and may change without notice. The material is not intended as a complete analysis of every material fact regarding any country, region, market, industry, investment or strategy. This information is intended for US residents only.
Disclosure: Interactive Brokers Third Party
Information posted on IBKR Campus that is provided by third-parties does NOT constitute a recommendation that you should contract for the services of that third party. Third-party participants who contribute to IBKR Campus are independent of Interactive Brokers and Interactive Brokers does not make any representations or warranties concerning the services offered, their past or future performance, or the accuracy of the information provided by the third party. Past performance is no guarantee of future results.
This material is from Investopedia and is being posted with its permission. The views expressed in this material are solely those of the author and/or Investopedia and Interactive Brokers is not endorsing or recommending any investment or trading discussed in the material. This material is not and should not be construed as an offer to buy or sell any security. It should not be construed as research or investment advice or a recommendation to buy, sell or hold any security or commodity. This material does not and is not intended to take into account the particular financial conditions, investment objectives or requirements of individual customers. Before acting on this material, you should consider whether it is suitable for your particular circumstances and, as necessary, seek professional advice.
Disclosure: ETFs
Any discussion or mention of an ETF is not to be construed as recommendation, promotion or solicitation. All investors should review and consider associated investment risks, charges and expenses of the investment company or fund prior to investing. Before acting on this material, you should consider whether it is suitable for your particular circumstances and, as necessary, seek professional advice.


Join The Conversation
For specific platform feedback and suggestions, please submit it directly to our team using these instructions.
If you have an account-specific question or concern, please reach out to Client Services.
We encourage you to look through our FAQs before posting. Your question may already be covered!