From SIA Charts
1/ Ford Motor Company – (F)
2/ Point and Figure Chart
Investopedia is partnering with CMT Association on this newsletter. The contents of this newsletter are for informational and educational purposes only, however, and do not constitute investing advice. The guest authors, which may sell research to investors, and may trade or hold positions in securities mentioned herein do not represent the views of CMT Association or Investopedia. Please consult a financial advisor for investment recommendations and services.
1/
Ford Motor Company – (F)

Courtesy of SIA Charts
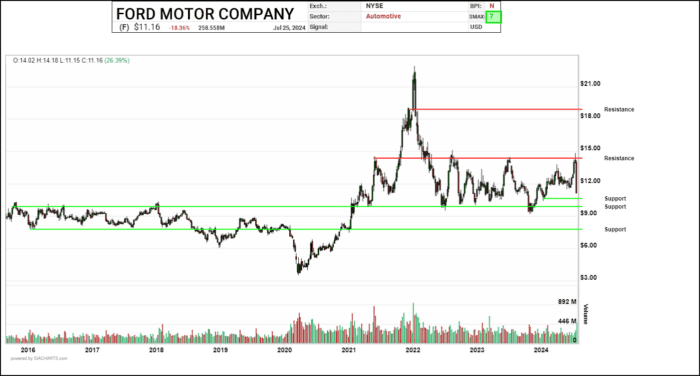
Ford Motor’s shares fell over 13% to a near six-month low on Thursday after the automaker missed second-quarter profit estimates, struggling with quality-related costs and intense competition in its EV business. This drop is disappointing for investors, who had seen Ford’s shares rise from $11.50 and approach resistance at $14.75 during a summer rally. The pullback confines the shares to a trading range that has persisted for nearly two years ($10.11-$14.74). This situation illustrates why we maintain a Neutral Yellow Zone in our matrix and emphasize the importance of buying positions that are high up in the Favored Green Zone, especially when the entry level is near resistance and trade risk/reward metrics are poor (i.e., low upside to resistance and high downside to support). The significant decline on the Relative Strength (RS) chart (see arrow) now places it deep in the Unfavored Red Zone at #97, down 53 spots yesterday and 38 for the quarter. Shares are now down 23.30% on the week and 13.24% in the past year, while the S&P 100 Index is up 9.94%, resulting in an opportunity loss of 23.18%. To analyze trading ranges, we can use the candlestick chart dating back to 2015. After breaking out of a prior range of approximately $7-$9 that lasted from 2015 to 2021, Ford’s shares surged to $22 before settling into a new range of $10-$15. Despite several attempts to break out in recent years, the stock has faced distribution around the $14-$15 level. Although the RS chart improves and turns Neutral Yellow, the stock often fails and falls back into the Red Zone. A meaningful breakout above $15, coupled with a strong rally in the RS and entry into the Favored Green Zone, will be necessary before Ford can target its previous long-term resistance of $22.

2/
Point and Figure Chart
Examining the Point and Figure chart reveals more precise ranges, with support at $10.11 and $9.16, initial resistance at $12.09 (3-box reversal), and top resistance at $14.74. Overall, the chart looks decent, and if support holds, brighter days could be ahead for Ford Motor Company. Deep value/trap investors (DON’T) will no doubt find it tantalizing to buy at the $10 support level (with a stop), for a favorable risk/reward ratio on this range-bound stock. With a SMAX score of 7 out of 10 (a near-term indicator comparing an asset against various asset classes), Ford is showing strong short-term performance across all asset classes, even after recent market fluctuations.

Courtesy of SIA Charts
—
Originally posted 29th July 2024
Join The Conversation
For specific platform feedback and suggestions, please submit it directly to our team using these instructions.
If you have an account-specific question or concern, please reach out to Client Services.
We encourage you to look through our FAQs before posting. Your question may already be covered!
Leave a Reply
Disclosure: Investopedia
Investopedia.com: The comments, opinions and analyses expressed herein are for informational purposes only and should not be considered individual investment advice or recommendations to invest in any security or to adopt any investment strategy. While we believe the information provided herein is reliable, we do not warrant its accuracy or completeness. The views and strategies described on our content may not be suitable for all investors. Because market and economic conditions are subject to rapid change, all comments, opinions and analyses contained within our content are rendered as of the date of the posting and may change without notice. The material is not intended as a complete analysis of every material fact regarding any country, region, market, industry, investment or strategy. This information is intended for US residents only.
Disclosure: Interactive Brokers Third Party
Information posted on IBKR Campus that is provided by third-parties does NOT constitute a recommendation that you should contract for the services of that third party. Third-party participants who contribute to IBKR Campus are independent of Interactive Brokers and Interactive Brokers does not make any representations or warranties concerning the services offered, their past or future performance, or the accuracy of the information provided by the third party. Past performance is no guarantee of future results.
This material is from Investopedia and is being posted with its permission. The views expressed in this material are solely those of the author and/or Investopedia and Interactive Brokers is not endorsing or recommending any investment or trading discussed in the material. This material is not and should not be construed as an offer to buy or sell any security. It should not be construed as research or investment advice or a recommendation to buy, sell or hold any security or commodity. This material does not and is not intended to take into account the particular financial conditions, investment objectives or requirements of individual customers. Before acting on this material, you should consider whether it is suitable for your particular circumstances and, as necessary, seek professional advice.


I’m suprised Americans still buy FORD at how ugly their cars are, when compared with competitors. Not to mention the disasterous mpg consumptions… Too bad Ford’s pride stands against joining the world with innovation, and when they do – they are way too late (Pride again).