


By Ryan Gorman, CFA, CMT, BFA
Finding the Squeeze
Investopedia is partnering with CMT Association on this newsletter. The contents of this newsletter are for informational and educational purposes only, however, and do not constitute investing advice. The guest authors, which may sell research to investors, and may trade or hold positions in securities mentioned herein do not represent the views of CMT Association or Investopedia. Please consult a financial advisor for investment recommendations and services.
Finding the Squeeze
It has been a joy looking at the market with you this week. An interesting one for sure. For Friday finally, I wanted to teach you a way to find a chart pattern I have liked to trade. Though John Bollinger has done a lot of work on this, I learned about this in Mastering the Trade by John Carter.
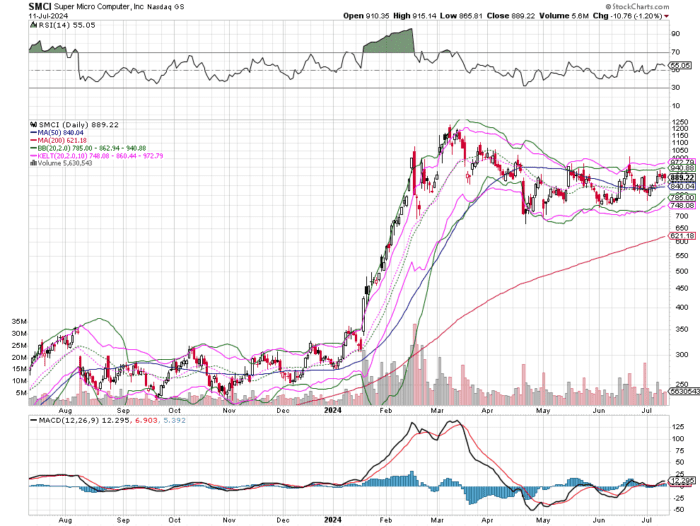
It’s called a squeeze, and it is when the Bollinger band, a measure of standard deviation is within the Keltner channels, a measure of average true range. Both measure volatility with the idea being that period of low volatility lead to periods of high volatility and sometimes large moves.
If you are a stock charts user, I can give you the scan I use here:
[type is stock]
and [country is US]
and [Upper BB(20,2) <= Upper Kelt Chan(20,1.5,10)]
and [Lower BB(20,2) >= Lower Kelt Chan(20,1.5,10)]
and [Close > .2]
and [Volume > 1,000,000]
From there, I flip through the list to find good setups. One that stood out toward the top of the list was SMCI, a recent darling.
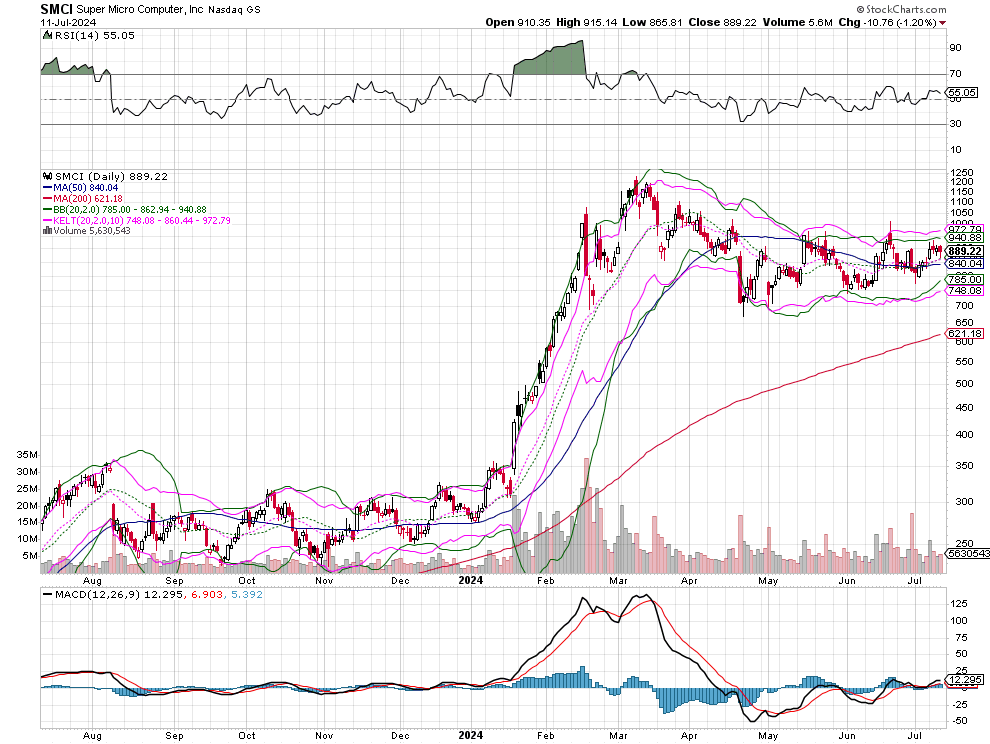
Courtesy of StockCharts.com
How you trade this depends on how aggressive you are. Waiting for a breakout either way is one of the more conservative methods. If you have an edge, you can accumulate within the range but there are no rules I have noticed on how long it takes to break out. Here, the RSI has been improving. One may look for a breakout to the upside.
I hope you have found these charts helpful and find your own way with the squeeze setup.
—-
Originally posted 12th July 2024
Join The Conversation
For specific platform feedback and suggestions, please submit it directly to our team using these instructions.
If you have an account-specific question or concern, please reach out to Client Services.
We encourage you to look through our FAQs before posting. Your question may already be covered!
Leave a Reply
Disclosure: Investopedia
Investopedia.com: The comments, opinions and analyses expressed herein are for informational purposes only and should not be considered individual investment advice or recommendations to invest in any security or to adopt any investment strategy. While we believe the information provided herein is reliable, we do not warrant its accuracy or completeness. The views and strategies described on our content may not be suitable for all investors. Because market and economic conditions are subject to rapid change, all comments, opinions and analyses contained within our content are rendered as of the date of the posting and may change without notice. The material is not intended as a complete analysis of every material fact regarding any country, region, market, industry, investment or strategy. This information is intended for US residents only.
Disclosure: Interactive Brokers Third Party
Information posted on IBKR Campus that is provided by third-parties does NOT constitute a recommendation that you should contract for the services of that third party. Third-party participants who contribute to IBKR Campus are independent of Interactive Brokers and Interactive Brokers does not make any representations or warranties concerning the services offered, their past or future performance, or the accuracy of the information provided by the third party. Past performance is no guarantee of future results.
This material is from Investopedia and is being posted with its permission. The views expressed in this material are solely those of the author and/or Investopedia and Interactive Brokers is not endorsing or recommending any investment or trading discussed in the material. This material is not and should not be construed as an offer to buy or sell any security. It should not be construed as research or investment advice or a recommendation to buy, sell or hold any security or commodity. This material does not and is not intended to take into account the particular financial conditions, investment objectives or requirements of individual customers. Before acting on this material, you should consider whether it is suitable for your particular circumstances and, as necessary, seek professional advice.


Very helpful. Noted you used stockcharts.com. I am on Interactive Brokers platform. Would like IB to provide us similar features. TY.
Hello, thank you for reaching out. Please send specific suggestions about TWS to twsfeedback@interactivebrokers.com. There is also a New Feature Poll in Client Portal https://portal.interactivebrokers.com/portal/#/suggestions where IBKR users can vote and comment on each other’s suggestions. We appreciate your feedback!