By Fadi Dawood
1/ NVIDIA ($NVDA): Testing Key Support After Recent Pullback
2/ Snowflake ($SNOW): Breakout Above 200-Day SMA, Momentum Pauses
Investopedia is partnering with CMT Association on this newsletter. The contents of this newsletter are for informational and educational purposes only, however, and do not constitute investing advice. The guest authors, which may sell research to investors, and may trade or hold positions in securities mentioned herein do not represent the views of CMT Association or Investopedia. Please consult a financial advisor for investment recommendations and services.
1/
NVIDIA ($NVDA): Testing Key Support After Recent Pullback
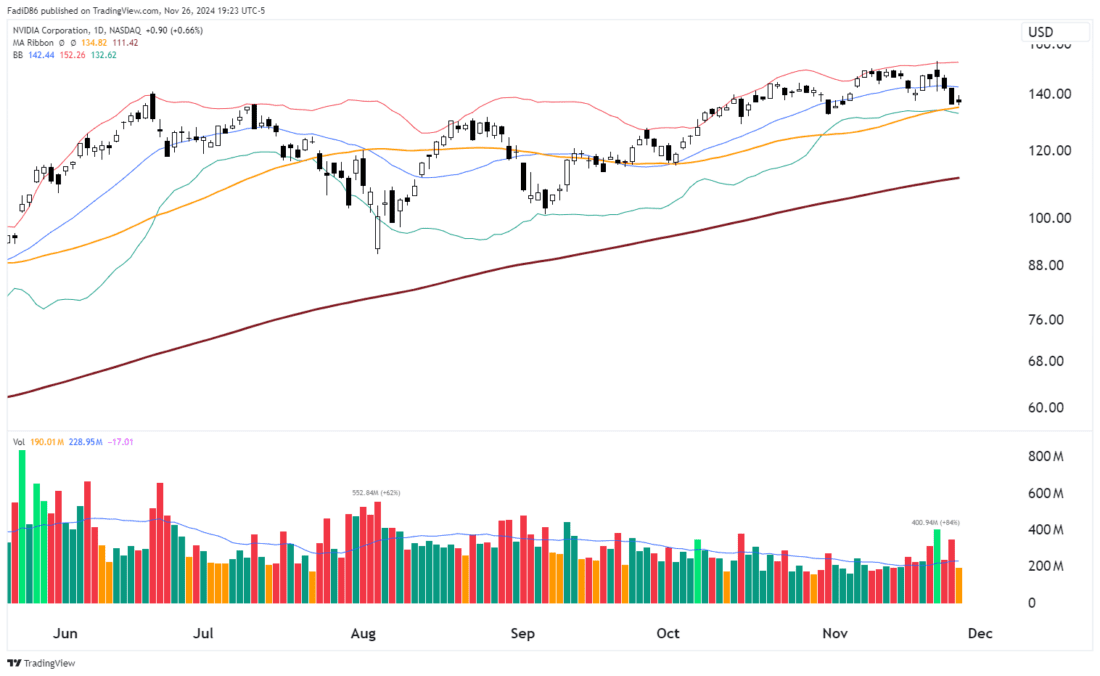
NVIDIA Corporation ($NVDA) has been a standout performer, but recent price action suggests a pullback is underway as the stock tests critical support levels. While the long-term trend remains intact, shorter-term momentum appears to be slowing.
NVDA reached a high near $152 earlier this month before pulling back sharply toward the 50-day SMA (orange line), currently at $134.82. Price action indicates a test of support near this level, with the 20-day SMA ($142.44) also acting as immediate resistance. This consolidation suggests a potential pause in the stock’s broader uptrend.
The 200-day SMA (thick maroon line) at $111.42 remains well below current price levels, signaling that the long-term trend remains bullish. However, the recent inability to sustain gains above the upper Bollinger Band indicates some exhaustion in buying momentum.

Volume has been declining during the pullback, which is generally a constructive sign for bulls, as it suggests the move lower is driven more by profit-taking than aggressive selling. However, spikes in selling volume earlier in the month could indicate caution among investors at higher levels.
Key Levels to Watch
- Support: The 50-day SMA ($134.82) is the immediate level to watch. A break below this could lead to a deeper pullback toward the 200-day SMA ($111.42).
- Resistance: The 20-day SMA ($142.44) and the recent high near $152 are key resistance levels. A breakout above these would confirm renewed bullish momentum.
$NVDA is consolidating after a strong rally, with the stock testing key support near the 50-day SMA. While the long-term uptrend remains intact, the recent pullback and rejection at the Bollinger Band suggest that the stock may need to digest gains further before resuming its climb. Traders should monitor support at $134.82 and resistance at $142.44 for clues on the next directional move. For now, $NVDA appears to be in a healthy consolidation phase within a broader uptrend.
2/
Snowflake ($SNOW): Breakout Above 200-Day SMA, Momentum Pauses
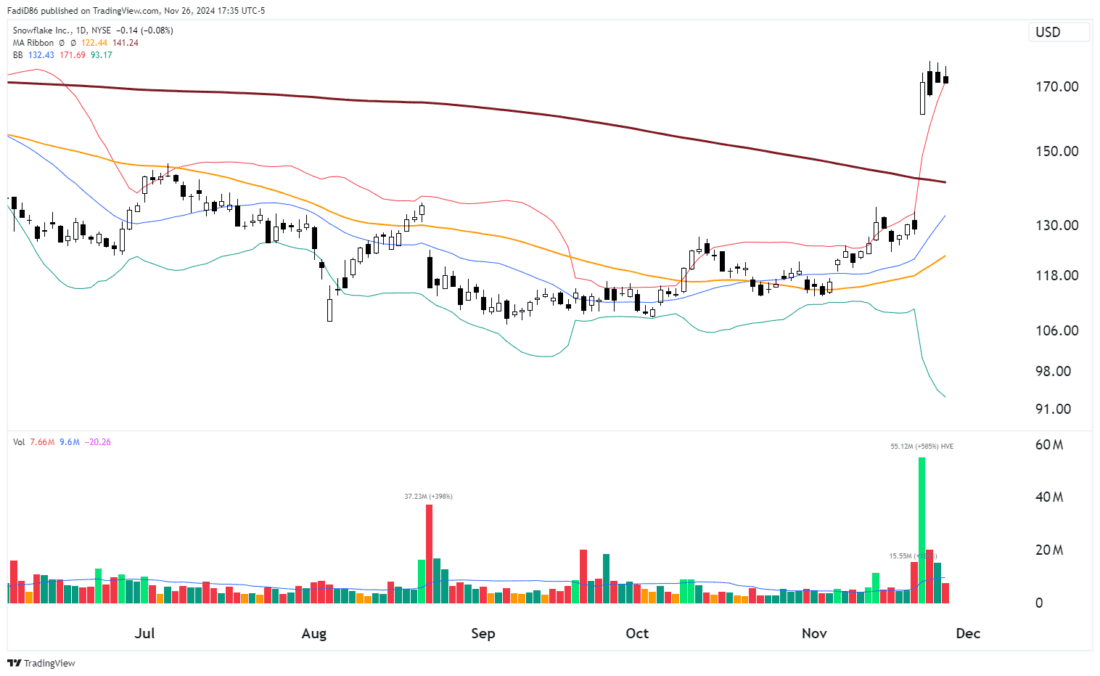
Snowflake Inc. ($SNOW) has seen an explosive breakout above the 200-day SMA, supported by significant volume, but recent price action suggests a pause in momentum as the stock consolidates near its recent highs.
$SNOW experienced a sharp rally in November, surging past key resistance levels, including the 200-day SMA (thick maroon line) at $141.24. The breakout propelled the stock above the upper Bollinger Band ($171.69), reaching a recent high near $175. However, after such an extended move, the stock is now consolidating within a tight range near its highs.

This consolidation suggests a healthy pause, allowing the stock to digest its gains. The ability to hold above the 200-day SMA and maintain levels near the upper Bollinger Band indicates that bulls remain in control.
Volume spiked dramatically during the breakout, with over 55 million shares traded—an increase of 585% above average. Such volume surges often signify institutional accumulation. However, recent sessions have seen declining volume, which is typical during consolidation phases. This volume profile suggests that the breakout remains supported but is currently lacking follow-through buying momentum.
The 200-day SMA, which previously acted as resistance, now serves as a key support level. Both the 50-day SMA ($122.44) and 20-day SMA ($132.43) are trending upward, reinforcing the intermediate and short-term bullish trends.
SNOW is also trading well above its 50-day SMA, underscoring the strength of its recent move. The upward alignment of all major moving averages signals that the stock is in the early stages of a potential sustained uptrend.
Traders should monitor for a breakout above $175 to confirm further upside or watch for signs of weakness near the 200-day SMA. For now, the stock appears poised for continued strength, provided it holds the 200 SMA.
—
Originally posted 27th November 2024
Disclosure: Investopedia
Investopedia.com: The comments, opinions and analyses expressed herein are for informational purposes only and should not be considered individual investment advice or recommendations to invest in any security or to adopt any investment strategy. While we believe the information provided herein is reliable, we do not warrant its accuracy or completeness. The views and strategies described on our content may not be suitable for all investors. Because market and economic conditions are subject to rapid change, all comments, opinions and analyses contained within our content are rendered as of the date of the posting and may change without notice. The material is not intended as a complete analysis of every material fact regarding any country, region, market, industry, investment or strategy. This information is intended for US residents only.
Disclosure: Interactive Brokers Third Party
Information posted on IBKR Campus that is provided by third-parties does NOT constitute a recommendation that you should contract for the services of that third party. Third-party participants who contribute to IBKR Campus are independent of Interactive Brokers and Interactive Brokers does not make any representations or warranties concerning the services offered, their past or future performance, or the accuracy of the information provided by the third party. Past performance is no guarantee of future results.
This material is from Investopedia and is being posted with its permission. The views expressed in this material are solely those of the author and/or Investopedia and Interactive Brokers is not endorsing or recommending any investment or trading discussed in the material. This material is not and should not be construed as an offer to buy or sell any security. It should not be construed as research or investment advice or a recommendation to buy, sell or hold any security or commodity. This material does not and is not intended to take into account the particular financial conditions, investment objectives or requirements of individual customers. Before acting on this material, you should consider whether it is suitable for your particular circumstances and, as necessary, seek professional advice.


Join The Conversation
For specific platform feedback and suggestions, please submit it directly to our team using these instructions.
If you have an account-specific question or concern, please reach out to Client Services.
We encourage you to look through our FAQs before posting. Your question may already be covered!