
- Solve real problems with our hands-on interface
- Progress from basic puts and calls to advanced strategies
Interactive Options Course

Posted August 18, 2025 at 9:20 am
From SIA Charts
1/ Constellation Software Inc. (CSU.TO)
2/ Hypothetical Canadian 5 Stock Model
3/ Point and Figure Chart
Investopedia is partnering with CMT Association on this newsletter. The contents of this newsletter are for informational and educational purposes only, however, and do not constitute investing advice. The guest authors, which may sell research to investors, and may trade or hold positions in securities mentioned herein do not represent the views of CMT Association or Investopedia. Please consult a financial advisor for investment recommendations and services.
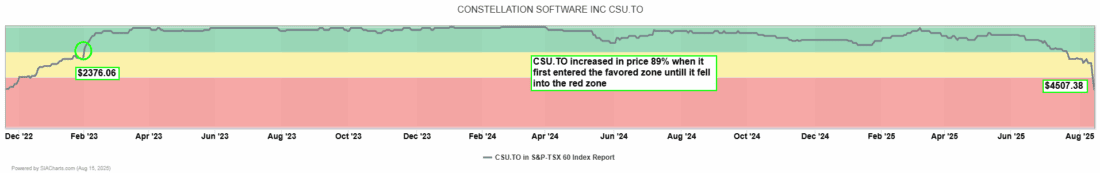
Constellation Software Inc. (CSU.TO)
SIA Charts’ relative strength rankings assist investors in identifying stocks and sectors that are outperforming and underperforming their peers or index benchmarks. Underperformance typically indicates negative investor expectations for a company or sector, The rankings not only help investors to identify which stocks in a universe are underperforming against their peers, but also when relative performance trends are changing. As we highlighted in yesterday’s Equity Leaders Weekly, the SIA Computer Software Sector has been showing some overall weakness of late. The SIA Computer Software Sector in the Market Sector Report has steadily fallen into the Yellow Zone, down 6 Spots in the last week, 10 spots in the last month and 11 spots in the last quarter. As such, let’s highlight, the Canadian Computer Software Stock, Constellation Software Inc. in today’s Daily Stock Report as it has experienced some underperformance of late.
We last spoke about Constellation Software Inc (CSU.TO) over two years ago back on May 16, 2023. CSU.TO entered the favored zone of the SIA S&P/TSX 60 Index Report a few months earlier on Feb 1, 2023, at a price of $2376.06. Since that time, the shares have remained in the favored zone up until two days ago on Aug 13 when it fell into the red unfavored zone of the report indicating it was time to look for other opportunities that are showing more strength. When the shares entered the red unfavored zone, the shares closed at a price of $4507.38 which represents a gain of over 89% upon first entering the favored zone and then entering the red zone. CSU.TO currently resides in the red zone of the SIA S&P/TSX 60 Index report at the #40 spot, down 25 spots in the last month and 34 spots in the last quarter. This exemplifies the power of SIA’s Relative Strength Analysis Signals on when to look at a name and when to leave a name and look for better opportunities.
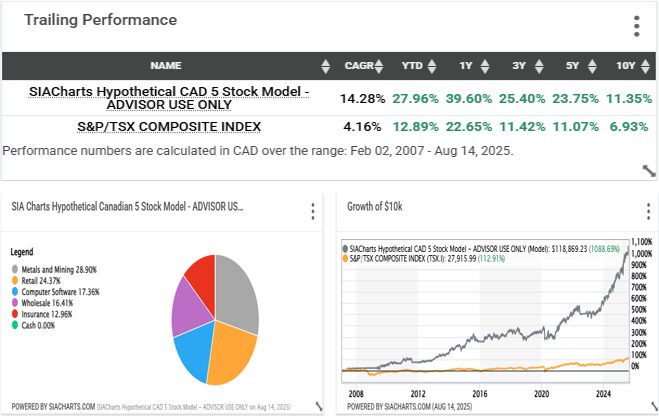
Hypothetical Canadian 5 Stock Model
Constellation Software was also a holding in the SIA Hypothetical Canadian 5 Stock Model. On March 16th, 2023, the SIA Hypothetical Canadian model issued a trade signal and at that time CSU.TO was added to the model at a price of $2281.72 as that was the highest-ranking stock in the TSX 60 Index report at that time. The SIA Algorithm triggered a red unfavored signal two days ago which was when CSU.TO was removed from this model the following morning (Aug 14th) when the shares opened at a price of $4601.88. This reflects over a doubling in price while CSU.TO was in the model during this time.
The performance metrics of the SIA Hypothetical Canadian 5 Stock Model further illustrates the power of this approach. The model has achieved a ten-year annualized trailing performance of 11.35% versus the S&P/TSX Composite Index benchmark return of only 6.93%. The five-year annualized trailing performance is 23.75% which is more than double the five-year annualized return of the S&P/TSX Composite Index as of Aug 14, 2025.
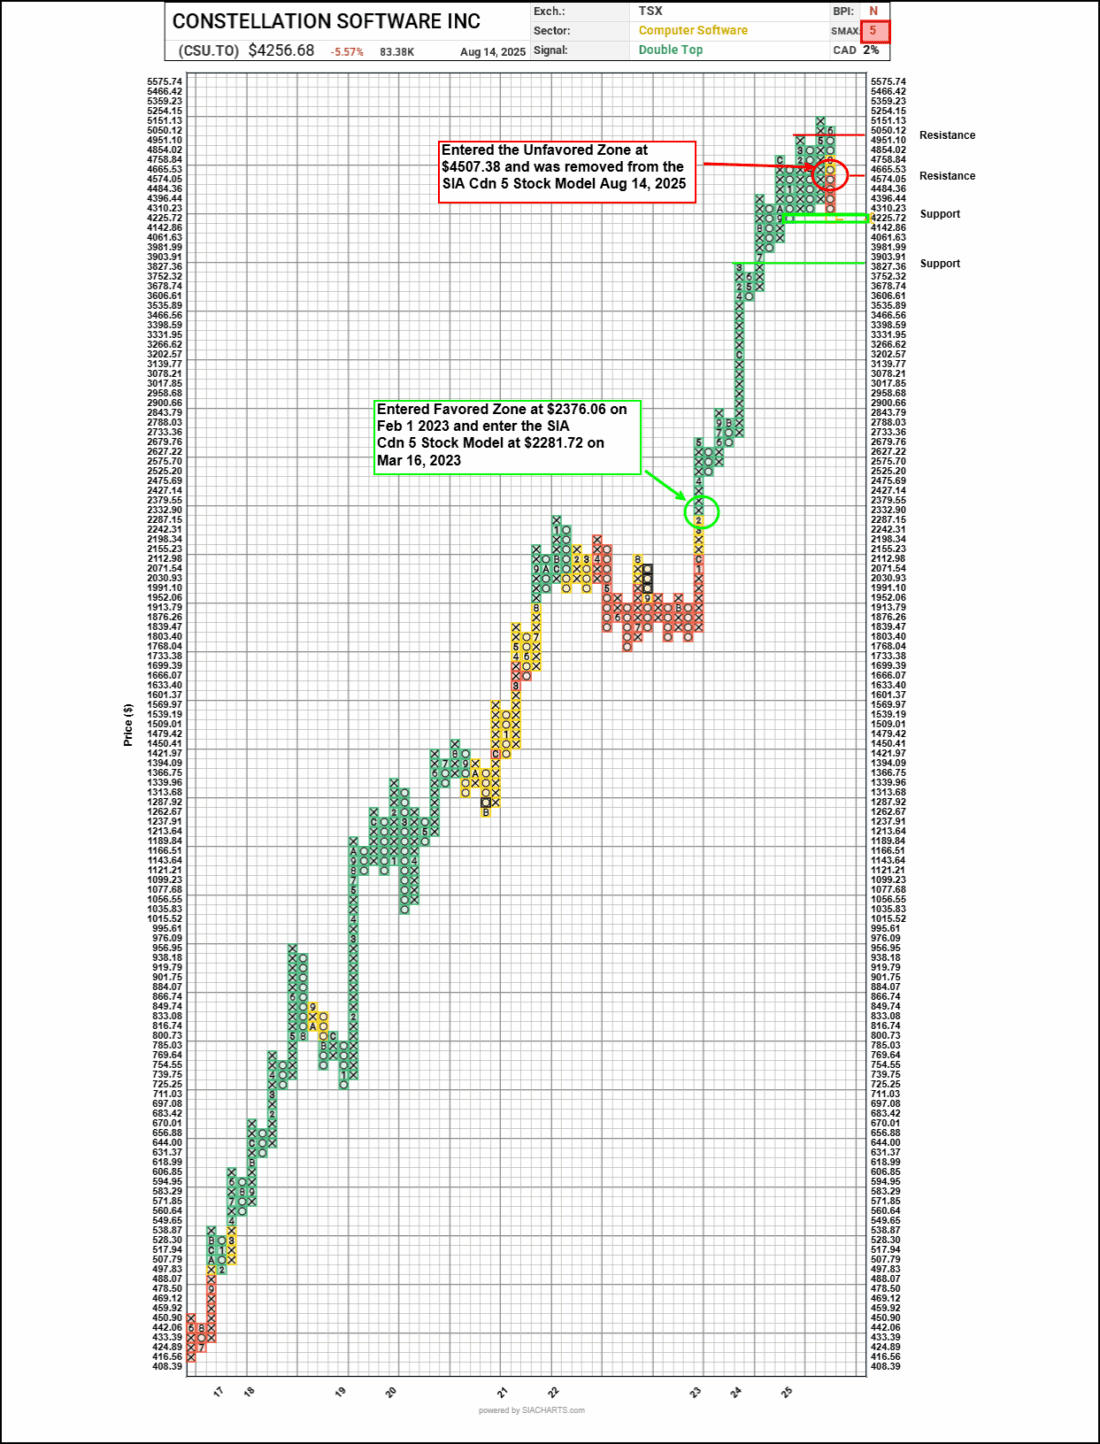
Point and Figure Chart
Let’s look at the Point and Figure chart at a 2% scale for an investment grade analysis. The benefit of looking at Point and Figure Charts is you can see more precisely upcoming support and resistance points. We have also overlaid the SIA Report Overlay tool to show you how the stock has performed while in the green favored zone.
Looking ahead, the stock now faces resistance at its 3-box reversal point of $4665.53. If it manages to go past this point, next resistance is at the round number and phycological number of $5000.00.
On the downside, we are right at initial support at the $4142.86 to $4225.72 price point. If it fails to hold here, next support is at $3827.36. Taken together, this suggests potential additional downside risk of up to 11% from current levels. The shares currently exhibit a SMAX score of 5 out of 10 which is not very much short-term strength against the asset classes, and the sector rating has now gone Neutral indicating a deteriorating sector backdrop.
The Hypothetical Canadian 5-stock selection process recommends the top 5 relative strength-ranked names from the SIA S&P/TSX 60 universe as we are always looking for the strongest names possible in the report, limiting selections to one stock per sector for diversification. When a holding is sold, it is replaced with the highest-ranked stock from the Relative Strength rankings with a SMAX score of 6 or higher. If the top-ranked stock already has a sector holding in the current model, the next highest-ranked stock is chosen. The strategy will sell any investment that moves to the Neutral zone of the report with a SMAX score of 5 or less or to the Unfavored zone which was the case for Constellation Software Inc. This model is frequently used by elite advisors as a component in a broader North American strategy, often combined with other SIA Hypothetical Model Sleeves like SIA’s Nasdaq 5 Stock, US 5 Stock and the Canadian Equity Income 5 stock model, for a diversified roster of holdings.
—
Originally posted 15th August 2025
Investopedia.com: The comments, opinions and analyses expressed herein are for informational purposes only and should not be considered individual investment advice or recommendations to invest in any security or to adopt any investment strategy. While we believe the information provided herein is reliable, we do not warrant its accuracy or completeness. The views and strategies described on our content may not be suitable for all investors. Because market and economic conditions are subject to rapid change, all comments, opinions and analyses contained within our content are rendered as of the date of the posting and may change without notice. The material is not intended as a complete analysis of every material fact regarding any country, region, market, industry, investment or strategy. This information is intended for US residents only.
Information posted on IBKR Campus that is provided by third-parties does NOT constitute a recommendation that you should contract for the services of that third party. Third-party participants who contribute to IBKR Campus are independent of Interactive Brokers and Interactive Brokers does not make any representations or warranties concerning the services offered, their past or future performance, or the accuracy of the information provided by the third party. Past performance is no guarantee of future results.
This material is from Investopedia and is being posted with its permission. The views expressed in this material are solely those of the author and/or Investopedia and Interactive Brokers is not endorsing or recommending any investment or trading discussed in the material. This material is not and should not be construed as an offer to buy or sell any security. It should not be construed as research or investment advice or a recommendation to buy, sell or hold any security or commodity. This material does not and is not intended to take into account the particular financial conditions, investment objectives or requirements of individual customers. Before acting on this material, you should consider whether it is suitable for your particular circumstances and, as necessary, seek professional advice.
Related Articles


Join The Conversation
For specific platform feedback and suggestions, please submit it directly to our team using these instructions.
If you have an account-specific question or concern, please reach out to Client Services.
We encourage you to look through our FAQs before posting. Your question may already be covered!