
- Solve real problems with our hands-on interface
- Progress from basic puts and calls to advanced strategies
Interactive Options Course
Posted October 9, 2024 at 9:55 am
From SIA Charts
1/ Daily Stock Report: Fedex Corp. – (FDX)
2/ Performance
3/ Point and Figure Chart
Investopedia is partnering with CMT Association on this newsletter. The contents of this newsletter are for informational and educational purposes only, however, and do not constitute investing advice. The guest authors, which may sell research to investors, and may trade or hold positions in securities mentioned herein do not represent the views of CMT Association or Investopedia. Please consult a financial advisor for investment recommendations and services.
Fedex Corp. – (FDX)
Courtesy of SIA Charts
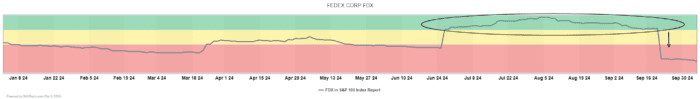
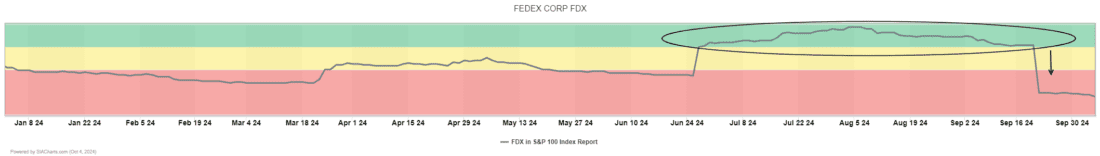
Shares of FedEx have fallen sharply in the SIA S&P 100 Index Report after previously rising to the top of the matrix report during the summer. The SIA Matrix Position chart shows a significant decline in relative strength, indicating that something significant appears to be afoot with FedEx, as investors are quickly exiting their positions. Currently, shares are positioned at #83 in the Unfavored zone of the report, having dropped 64 spots in just the past month.
Performance
Courtesy of SIA Charts
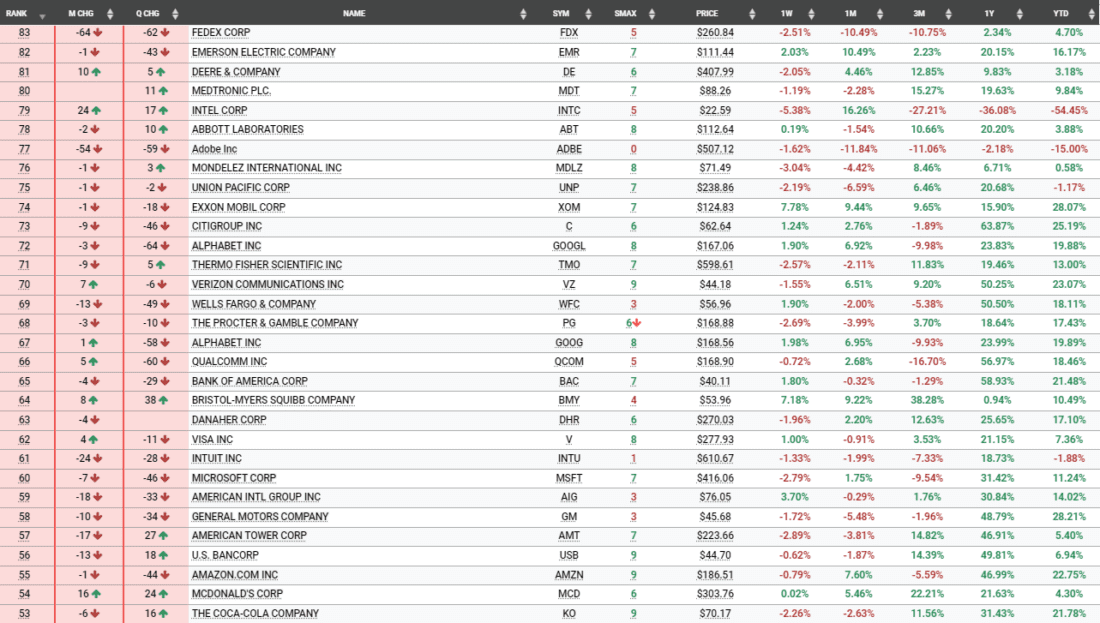
FedEx’s recent performance includes a monthly decline of -10.49% and a quarterly decline of -10.75%, although the year-to-date performance remains positive at +4.70%. In comparison, the S&P 100 Index benchmark has increased by +3.08% over the past month and +8.24% over the past quarter.
Point and Figure Chart
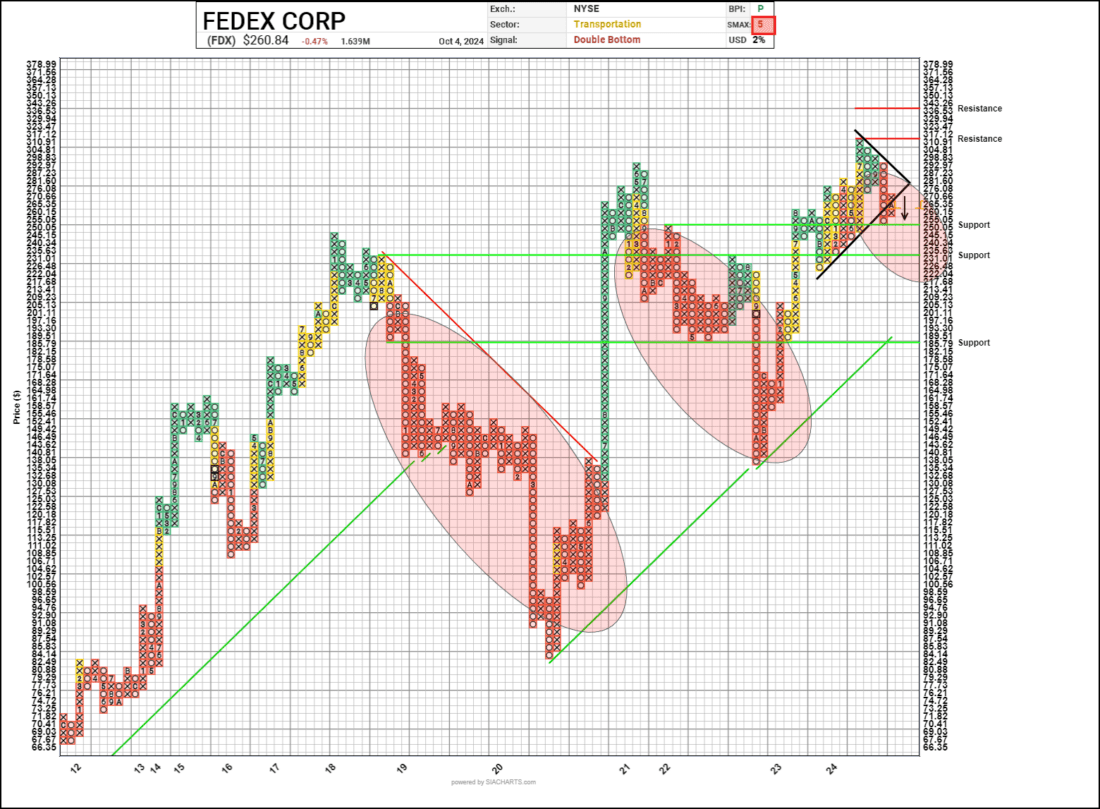
To gain perspective on FedEx’s trading activities, we turn to the point and figure chart. Earlier in the summer, this chart signaled a bullish trend, but that now appears to have been a bull trap, increasing the risks associated with the position, especially in light of the SIA relative strength reversal. A point and figure bull trap is a situation in technical analysis where a stock appears to be breaking out to the upside (indicating a bullish trend) but then quickly reverses and moves downward instead. This apparent bull trap has now been followed by the completion of a bearish triangle, which is a point and figure bearish chart pattern marked by a consolidation period of lower highs and lower lows that signals a continuation of a downward trend in a stock’s price, often followed by a bearish breakdown. As such, investors should be mindful of any further breakdowns beyond support levels at $250.05, $231.01, and the long-term positive trend level at $185.79, while resistance levels are at $317.12 and $343.26. FedEx shares carry an SIA SMAX score of 5 out of a possible 10, suggesting that better investment opportunities exist in other asset classes. Investors should remain cautious given the current market dynamics and technical indicators at play.
Courtesy of SIA Charts
—-
Originally posted 9th October 2024
Investopedia.com: The comments, opinions and analyses expressed herein are for informational purposes only and should not be considered individual investment advice or recommendations to invest in any security or to adopt any investment strategy. While we believe the information provided herein is reliable, we do not warrant its accuracy or completeness. The views and strategies described on our content may not be suitable for all investors. Because market and economic conditions are subject to rapid change, all comments, opinions and analyses contained within our content are rendered as of the date of the posting and may change without notice. The material is not intended as a complete analysis of every material fact regarding any country, region, market, industry, investment or strategy. This information is intended for US residents only.
Information posted on IBKR Campus that is provided by third-parties does NOT constitute a recommendation that you should contract for the services of that third party. Third-party participants who contribute to IBKR Campus are independent of Interactive Brokers and Interactive Brokers does not make any representations or warranties concerning the services offered, their past or future performance, or the accuracy of the information provided by the third party. Past performance is no guarantee of future results.
This material is from Investopedia and is being posted with its permission. The views expressed in this material are solely those of the author and/or Investopedia and Interactive Brokers is not endorsing or recommending any investment or trading discussed in the material. This material is not and should not be construed as an offer to buy or sell any security. It should not be construed as research or investment advice or a recommendation to buy, sell or hold any security or commodity. This material does not and is not intended to take into account the particular financial conditions, investment objectives or requirements of individual customers. Before acting on this material, you should consider whether it is suitable for your particular circumstances and, as necessary, seek professional advice.
Related Articles


Join The Conversation
For specific platform feedback and suggestions, please submit it directly to our team using these instructions.
If you have an account-specific question or concern, please reach out to Client Services.
We encourage you to look through our FAQs before posting. Your question may already be covered!