
- Solve real problems with our hands-on interface
- Progress from basic puts and calls to advanced strategies
Interactive Options Course
Latest Webinars
Posted October 11, 2024 at 9:29 am
From SIA Charts
1/ Daily Stock Report: Carpenter Technology Corp – (CRS)
2/ Performance
3/ Point and Figure Chart
Investopedia is partnering with CMT Association on this newsletter. The contents of this newsletter are for informational and educational purposes only, however, and do not constitute investing advice. The guest authors, which may sell research to investors, and may trade or hold positions in securities mentioned herein do not represent the views of CMT Association or Investopedia. Please consult a financial advisor for investment recommendations and services.
Carpenter Technology Corp – (CRS)
Courtesy of SIA Charts
Carpenter Technology Corp. (CRS) is a global leader in high-performance specialty alloy materials and process solutions for critical applications in the aerospace, defense, and medical markets. With a market cap of $8.10 billion, CRS has distinguished itself as a top performer in the small to mid-cap segment of the thriving US equity market, benefiting from a favorable environment for specialty alloys. The company is experiencing growth driven by trends in precious and industrial metals, as well as manufacturing for key sectors such as aerospace, defense, utilities, electronics, semiconductors, medical, and EV auto manufacturing.
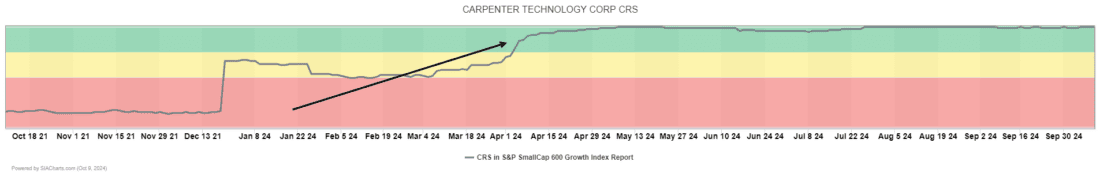
Performance
Courtesy of SIA Charts
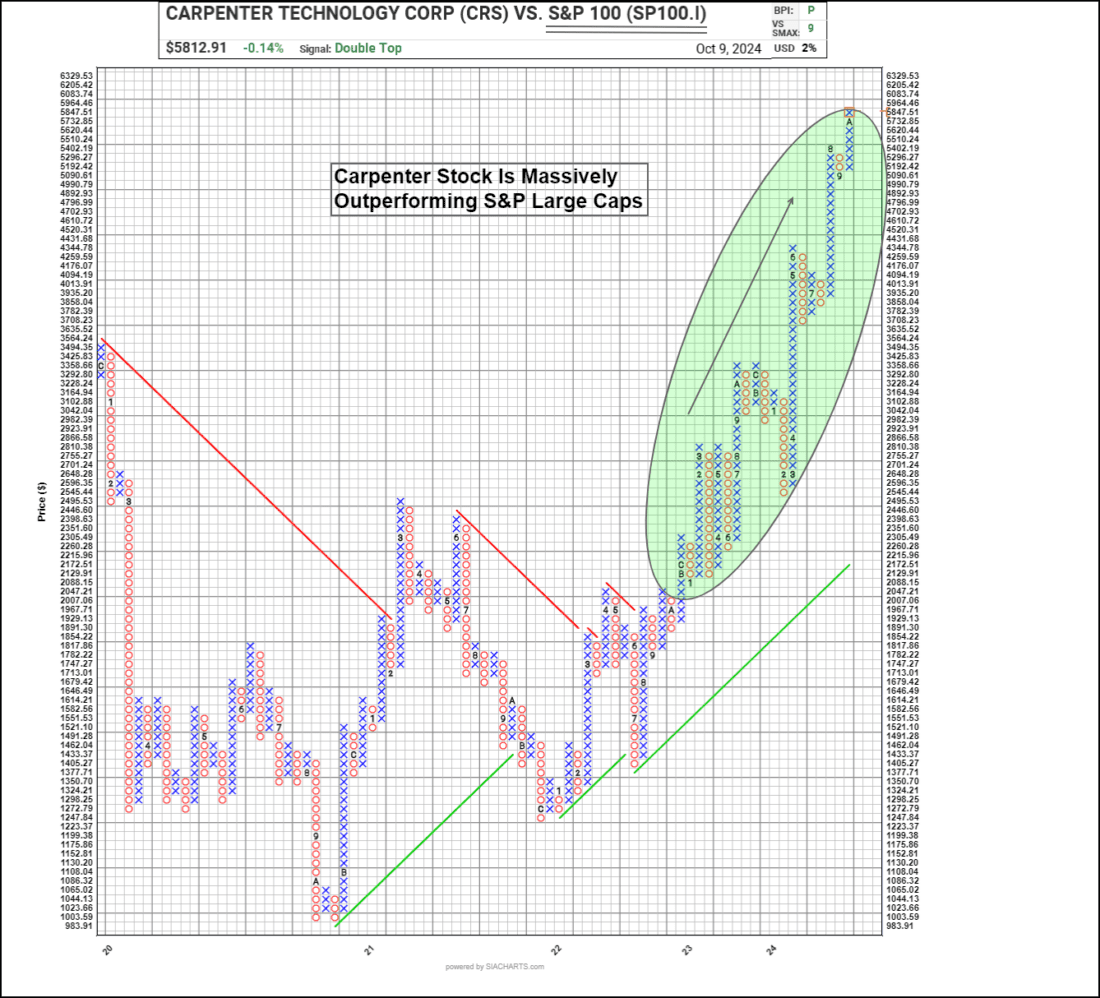
In Q1 of 2024, CRS garnered attention from SIA practitioners as it emerged as a leader in the SIA Small Cap 600 Growth Index. A comparison with the S&P 100 Index illustrates a significant breakout in CRS’s performance, especially a major breakout in early 2024 highlighted in the chart by the green oval.
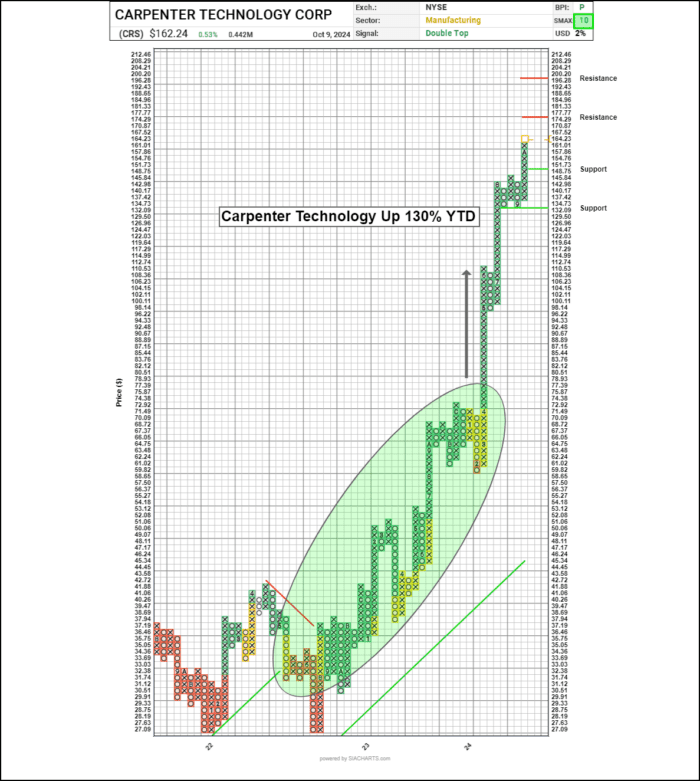
Point and Figure Chart
The second point-and-figure chart illustrates the movement of CRS shares throughout 2023 (see green oval), but significant acceleration occurred in the spring of 2024 when major fund flows began to pour into small caps. At that time, the share price surged past the $75 level, reaching current levels of $164.23, resulting in an impressive 118% gain for early investors. CRS shares remain positioned at spot #4 in the highly regarded SIA S&P Small Cap 600 Growth Index, indicating strong potential for further growth. Resistance levels can be established using a vertical count, with initial resistance at $177.77 followed by $200.20, which also corresponds to a significant psychological whole number. Support is first identified at the $148.75 (3-box) level, with additional support at $132.09. CRS shares carry a perfect SMAX score of 10 out of 10, further confirming that Carpenter shares are outperforming all other asset classes measured by the SIA AI Platform each day.

Courtesy of SIA Charts
—-
Originally posted on 11th October 2024
Investopedia.com: The comments, opinions and analyses expressed herein are for informational purposes only and should not be considered individual investment advice or recommendations to invest in any security or to adopt any investment strategy. While we believe the information provided herein is reliable, we do not warrant its accuracy or completeness. The views and strategies described on our content may not be suitable for all investors. Because market and economic conditions are subject to rapid change, all comments, opinions and analyses contained within our content are rendered as of the date of the posting and may change without notice. The material is not intended as a complete analysis of every material fact regarding any country, region, market, industry, investment or strategy. This information is intended for US residents only.
Information posted on IBKR Campus that is provided by third-parties does NOT constitute a recommendation that you should contract for the services of that third party. Third-party participants who contribute to IBKR Campus are independent of Interactive Brokers and Interactive Brokers does not make any representations or warranties concerning the services offered, their past or future performance, or the accuracy of the information provided by the third party. Past performance is no guarantee of future results.
This material is from Investopedia and is being posted with its permission. The views expressed in this material are solely those of the author and/or Investopedia and Interactive Brokers is not endorsing or recommending any investment or trading discussed in the material. This material is not and should not be construed as an offer to buy or sell any security. It should not be construed as research or investment advice or a recommendation to buy, sell or hold any security or commodity. This material does not and is not intended to take into account the particular financial conditions, investment objectives or requirements of individual customers. Before acting on this material, you should consider whether it is suitable for your particular circumstances and, as necessary, seek professional advice.
Related Articles


Join The Conversation
For specific platform feedback and suggestions, please submit it directly to our team using these instructions.
If you have an account-specific question or concern, please reach out to Client Services.
We encourage you to look through our FAQs before posting. Your question may already be covered!