
- Solve real problems with our hands-on interface
- Progress from basic puts and calls to advanced strategies
Interactive Options Course
Posted February 20, 2026 at 10:05 am
By Alex Cole
1/ The Problem
2/ The Complete Picture
3/ Data Visualization
Investopedia is partnering with CMT Association on this newsletter. The contents of this newsletter are for informational and educational purposes only, however, and do not constitute investing advice. The guest authors, which may sell research to investors, and may trade or hold positions in securities mentioned herein do not represent the views of CMT Association or Investopedia. Please consult a financial advisor for investment recommendations and services.
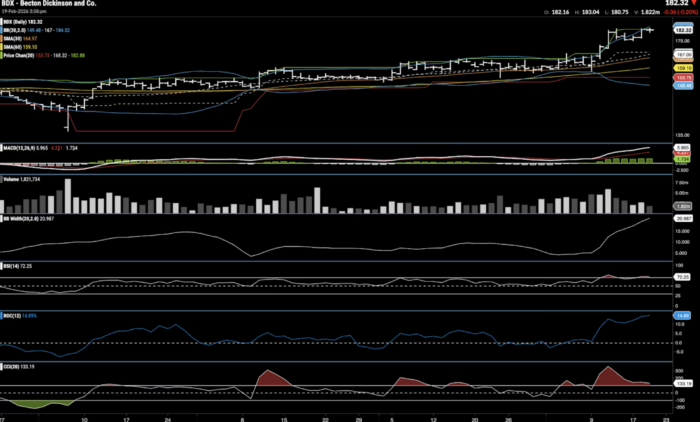
The Problem
So far in this series we have discussed the powerful insights we can get from the foundational concepts of technical analysis that help us understand trend, momentum, volume and volatility. We have argued that a disciplined checklist of tools can bring a greater peace of mind for the analyst and a weight of the evidence approach can bring confidence in a thesis. In this first chart, we have added all of the concepts that we have discussed this week to the price chart of BDX. Now we can really see the problem!
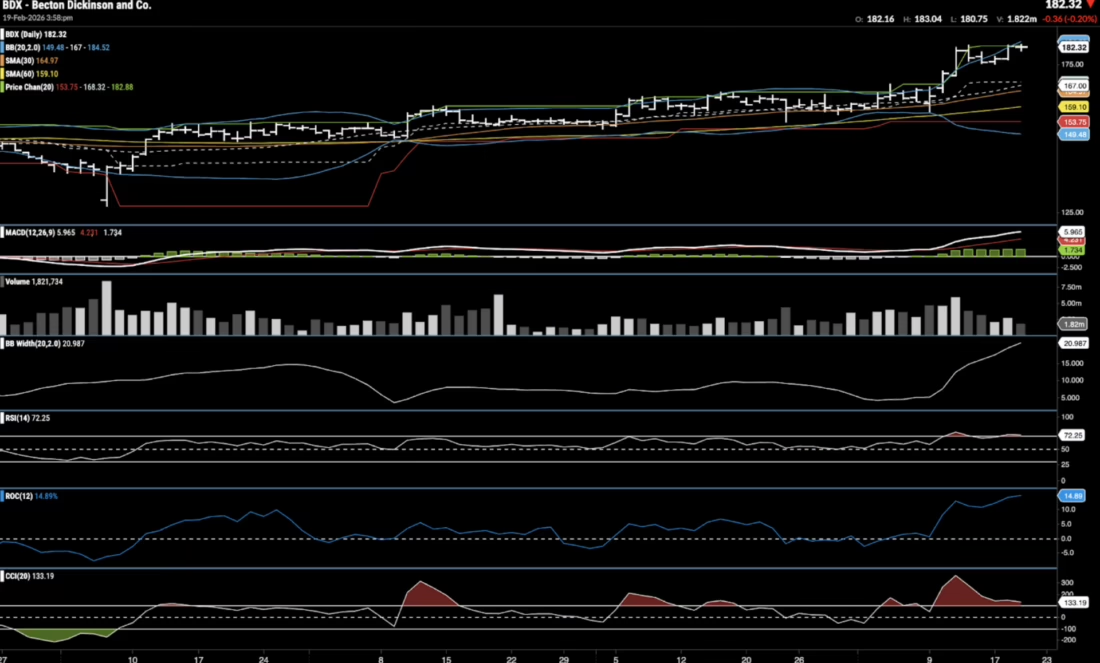
With only these indicators applied, we see how complicated it has become to make sense of the underlying price action. Where does the trend begin? Where are the areas of weakness, possible points of exhaustion? What does volume tell us, where are the periods of reduced volatility?
The Complete Picture
The core concept of GoNoGo Charts is to blend these foundational concepts and principles of technical analysis behind the scenes to give a complete understanding of price action without risking analysis paralysis. GoNoGo Trend color codes the price bar based on trend strength, giving an actionable visualization of price movements.
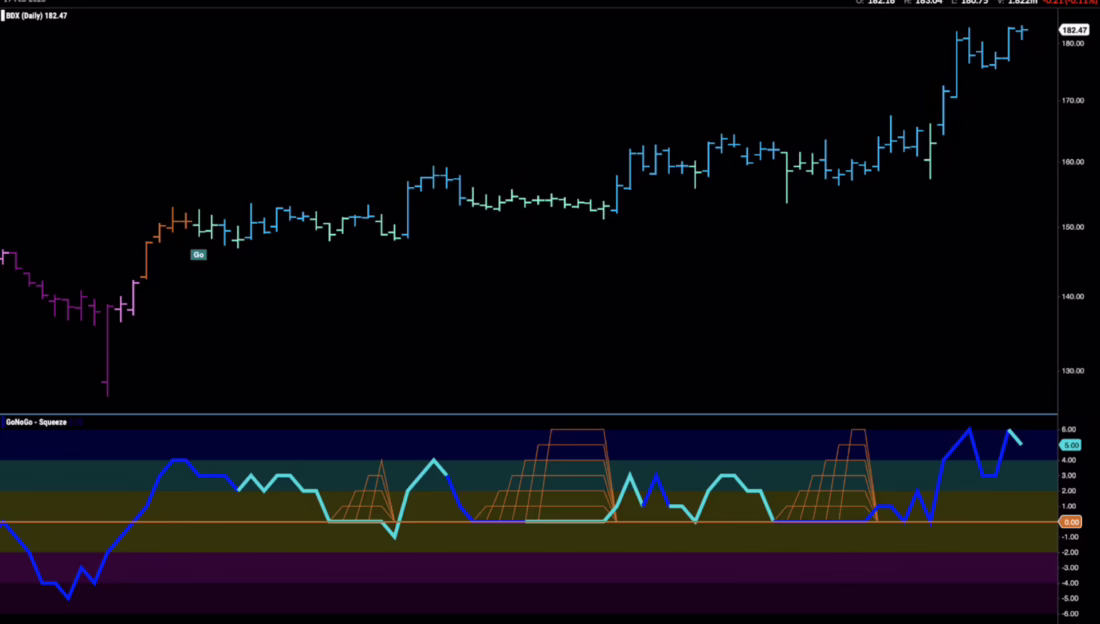
GoNoGo Oscillator blends several of the most robust momentum tools into one oscillator that allows for traditional momentum analysis. It is easy to see areas of overbought and oversold extremes, as well as look for momentum divergence. Volume is incorporated into the oscillator as it changes color based on volume relative to a historical average. Periods of reduced volatility are highlighted by the climbing amber grid of GoNoGo Squeeze. We have a complete understanding of the technical analysis of BDX with a chart that is easy to read.
Data Visualization
It can be said that data visualization is the democratization of data analysis. I have long believed that technicians are the data visualization experts of the financial world. With GoNoGo Charts, GoNoGo Icons help draw our eyes to the important information. This makes the information easier to absorb even for someone not used to looking at financial charts. In this last chart there are Trend Correction Icons (arrows) and Trend Continuation Icons (circles).
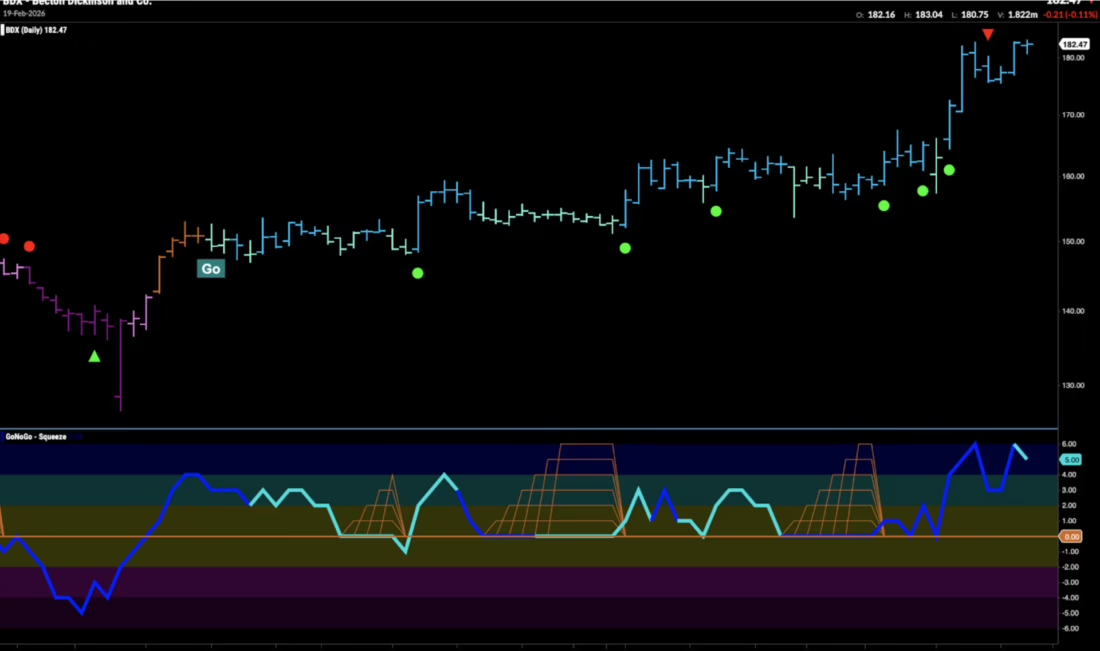
Trend Correction Icons appear when momentum has left an oversold or overbought extreme and moved back into neutral territory. This is a traditional way to read momentum indicators. In this chart, note the Go Trend Correction Icon (red arrow) at the latest high. This informs us that price may struggle to go higher in the short term due to waning momentum.
Trend Continuation Icons appear based on the interaction between trend and momentum. We learned of the importance of the zero line in a prior article, and Trend Continuation Icons highlight this. Note the Go Trend Correction Icons (green circles) throughout the trend. Each time the GoNoGo Oscillator bounces off the zero line we know that momentum is resurgent in the direction of the “Go” trend.
In this way, the analyst can gain invaluable insight into the complete technical picture and easily interpret the data in front of them.
—
Originally posted 20th February 2026
Investopedia.com: The comments, opinions and analyses expressed herein are for informational purposes only and should not be considered individual investment advice or recommendations to invest in any security or to adopt any investment strategy. While we believe the information provided herein is reliable, we do not warrant its accuracy or completeness. The views and strategies described on our content may not be suitable for all investors. Because market and economic conditions are subject to rapid change, all comments, opinions and analyses contained within our content are rendered as of the date of the posting and may change without notice. The material is not intended as a complete analysis of every material fact regarding any country, region, market, industry, investment or strategy. This information is intended for US residents only.
Information posted on IBKR Campus that is provided by third-parties does NOT constitute a recommendation that you should contract for the services of that third party. Third-party participants who contribute to IBKR Campus are independent of Interactive Brokers and Interactive Brokers does not make any representations or warranties concerning the services offered, their past or future performance, or the accuracy of the information provided by the third party. Past performance is no guarantee of future results.
This material is from Investopedia and is being posted with its permission. The views expressed in this material are solely those of the author and/or Investopedia and Interactive Brokers is not endorsing or recommending any investment or trading discussed in the material. This material is not and should not be construed as an offer to buy or sell any security. It should not be construed as research or investment advice or a recommendation to buy, sell or hold any security or commodity. This material does not and is not intended to take into account the particular financial conditions, investment objectives or requirements of individual customers. Before acting on this material, you should consider whether it is suitable for your particular circumstances and, as necessary, seek professional advice.
Related Articles


Join The Conversation
For specific platform feedback and suggestions, please submit it directly to our team using these instructions.
If you have an account-specific question or concern, please reach out to Client Services.
We encourage you to look through our FAQs before posting. Your question may already be covered!