
- Solve real problems with our hands-on interface
- Progress from basic puts and calls to advanced strategies
Interactive Options Course

Posted February 26, 2025 at 12:59 pm
Stocks are bouncing back from yesterday’s selloff, thanks to an upbeat sales outlook from Lowe’s partially offsetting the adverse impacts from yesterday’s dismal consumer confidence print and caution expressed during Home Depot’s earnings call. Also motivating buying activity is this afternoon’s largely awaited results from AI leader and semiconductor behemoth Nvidia. Market bulls are hoping that the chip juggernaut can counter concerns related to decelerating capital expenditures, foreign competition and trade restrictions by reporting blockbuster profitability and providing buoyant guidance. On the economic data front, stateside new home sales posted a sizeable decline last month, but industry participants have been quite optimistic about a recovery in recent days considering that the 30-year fixed has dwindled to a 6-handle, driven by fears of a slowdown and prospects for a decline in government spending submerging the long end of the curve. The dichotomy is quite significant and illustrated by real estate shifting from a cyclical sector to a defensive one in this post-pandemic economy. Emblematic of this development were REITs and the lumber commodity performing strongly alongside Treasurys during yesterday’s risk-off trading, pointing to housing momentum being much more influenced by borrowing costs rather than economic growth.
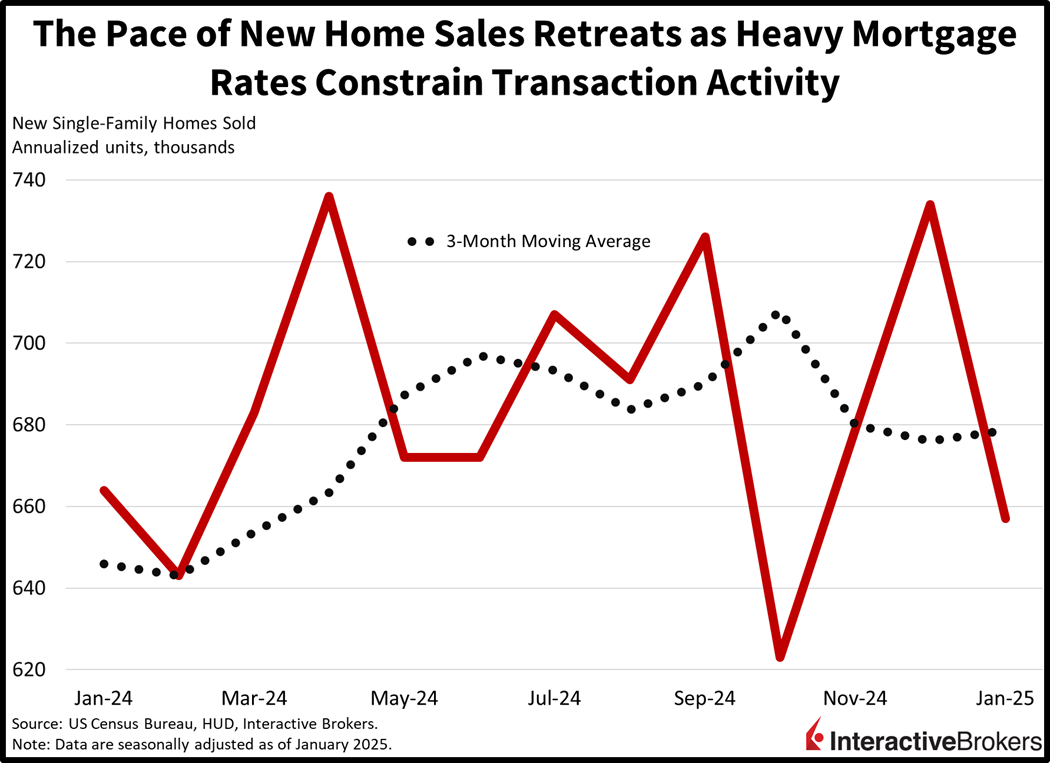
Real estate transactions started the year off on the wrong foot because lofty growth projections and tall term premiums pushed up mortgage rates to above 7%. But financing charges have sunk since, as activity and deficit expectations have moved south, leading to a flattening yield curve sporting a lower profile. However, January new home sales didn’t benefit from the bull flattening experienced this month, tanking to a pace of 657,000 seasonally adjusted annualized units (SAAU), a 10.5% month-over-month (m/m) decline and below the median estimate of 680,000. Most regions contributed to the weakness, except for the West, which gained 7.7% m/m as the area recovers from the wildfire disasters. The Northeast, Midwest, and South slid 20.6%, 16.7% and 14.8% during the period. Average and median prices advanced from $415,000 and $509,700 to $446,300 and $510,000 while inventories, expressed as the ratio of houses for sale to homes sold, expanded to 9.0 months from 8.0 in December. Excluding last October’s 9.2 months, January marks the loftiest level of supply since November 2022’s 9.2.
Markets are recovering strongly with investors buying the dip in cyclical sectors and technology. All major domestic benchmarks are gaining with the Russell 2000, Nasdaq 100, S&P 500 and Dow Jones indices up 1.2%, 1.1%, 0.9% and 0.4%. Sectoral breadth is strong as technology, industrials and utilities climb 1.9%, 1.1% and 1%. Just 3 of the 11 major segments are lower today. Traders are trimming consumer staples, healthcare and energy; those are down 1.2%, 0.2% and 0.2%. The Treasury curve is once again flattening, as traders favor the long end relative to the short end. The 2- and 10-year maturities are trading at 4.12% and 4.29%, 2 basis points (bps) heavier on the former but 1 bps lighter on the latter. The dollar is gaining, meanwhile, and its index is up 7 bps as the greenback appreciates versus most of its major counterparts, including the euro, franc, yen, yuan, loonie and Aussie tender. It is depreciating versus the pound sterling, however. Commodity price action is mixed with silver, lumber and crude oil up 0.4%, 0.1% and 0.1%. Gold is unchanged, but copper is down 1.9%. A weekly Energy Information Administration report on stateside energy supplies depicted a sharp drop but that wasn’t enough to counter economic growth worries and WTI crude is trading at $69.10, near its flatline, as a result.
This afternoon’s earnings call from Nvidia will be pivotal for economists and traders alike. A key point will be the order momentum for the company’s products, because AI adoption can continue to support economic growth through enhanced productivity, potentially offsetting concerns related to consumer spending endurance and labor market deterioration. Another important consideration will be the company’s views on trade restrictions as well as the tariff outlook and how they can impact revenues and profits. Finally, there will a focus on pricing and margins, especially since there’s been claims from global competitors of developing AI technologies at much lower costs.
Our IBKR ForecastTrader prediction market expects initial unemployment claims to arrive above 210,000 for the fourth-consecutive week. Indeed, the Yes contract, priced at $0.78, corresponds to a 78% chance that tomorrow’s print exceeds the 210,000 threshold. The weekly publication is top of mind for market participants, especially as federal downsizing plans worry folks about a potential uptick in joblessness. Furthermore, data so far this year point to an increasingly fragile consumer, raising the focus on high-frequency labor market indicators like weekly unemployment filings.

Source: ForecastEx
Singapore’s industrial production in January substantially exceeded expectations and reversed direction from the 5.4% m/m decline in the final month of last year. Industrial production jumped 9.1% and 4.5% y/y and m/m, respectively, compared to December’s 5.2% and -5.4% results, according to the Singapore Economic Development Board. Economists anticipated another m/m decline of 3.5%. The following y/y growth occurred within the stated sectors:
The sectors with the largest declines and the amounts of their contractions were as follows:
The nation benefited from order front running as a result of anxiety created by the potential for Trump tariffs. Still, Singapore is well positioned to serve as a manufacturing leader in Southeast Asia, especially as it relates to AI, but mounting trade tensions could weigh on transaction volumes and increase its reliance on its much larger services sector. The recent move by the Monetary Authority of Singapore to ease policy is well-timed in light of these risks and will provide incremental support to domestic demand, which presents an offsetting effect to the potential for softening exports.
Also in Asia, Hong Kong’s GDP growth picked up slightly while Japan’s Leading Economic Index (LEI) missed expectations. In the fourth quarter, Hong Kong’s GDP expanded 0.8% quarter over quarter (q/q) after declining 0.1% in the three-months ended in September. The gain was supported by an increase in exports. In another matter, Japan’s LEI strengthened from 107.8 to 108.3 m/m but missed the median forecast of 108.9.
Australia’s inflation rate remained steady at 2.5% y/y last month, despite projections for an increase to 2.6%. Still, there were broad increases across categories, with education, alcohol/tobacco, financial services and health registering price upticks of 6.5%, 6.4%, 5.3% and 4% y/y. But modest gains of 0.5%, 0.9%, 1%, 2.1% and 2.1% across the transportation, recreation/culture, furniture, housing and apparel served to counter the move north. Additionally, a 0.6% y/y decline in communications also helped to cushion the blow of higher prices.
The value of Australia’s completed construction projects rose just 0.5% q/q in the final three months of 2024 on the back of sluggish commercial activity. The headline figure was just half of the rate expected by economists and weaker than the 2% increase in the preceding period. However, the indicator climbed 1.8% relative to the same period in 2023 as reported by the Australian Bureau of Statistics. Residential construction climbed 0.9% q/q and 5.7% y/y while non-residential construction dipped 3.1% and 9.6%.
To learn more about ForecastEx, view our Traders’ Academy video here
New to Interactive Brokers?
Open AccountInformation posted on IBKR Campus that is provided by third-parties does NOT constitute a recommendation that you should contract for the services of that third party. Third-party participants who contribute to IBKR Campus are independent of Interactive Brokers and Interactive Brokers does not make any representations or warranties concerning the services offered, their past or future performance, or the accuracy of the information provided by the third party. Past performance is no guarantee of future results.
This material is from IBKR Macroeconomics, an affiliate of Interactive Brokers LLC, and is being posted with its permission. The views expressed in this material are solely those of the author and/or IBKR Macroeconomics and Interactive Brokers is not endorsing or recommending any investment or trading discussed in the material. This material is not and should not be construed as an offer to buy or sell any security. It should not be construed as research or investment advice or a recommendation to buy, sell or hold any security or commodity. This material does not and is not intended to take into account the particular financial conditions, investment objectives or requirements of individual customers. Before acting on this material, you should consider whether it is suitable for your particular circumstances and, as necessary, seek professional advice.
Interactive Brokers LLC is a CFTC-registered Futures Commission Merchant and a clearing member and affiliate of ForecastEx LLC (“ForecastEx”). ForecastEx is a CFTC-registered Designated Contract Market and Derivatives Clearing Organization. Interactive Brokers LLC provides access to ForecastEx Forecast Contracts for eligible customers. Interactive Brokers LLC does not make recommendations with respect to any products available on its platform, including those offered by ForecastEx.
This is commentary on economic, political and/or market conditions within the meaning of CFTC Regulation 1.71, and is not meant provide sufficient information upon which to base a decision to enter into a derivatives transaction.
Related Articles


Join The Conversation
For specific platform feedback and suggestions, please submit it directly to our team using these instructions.
If you have an account-specific question or concern, please reach out to Client Services.
We encourage you to look through our FAQs before posting. Your question may already be covered!