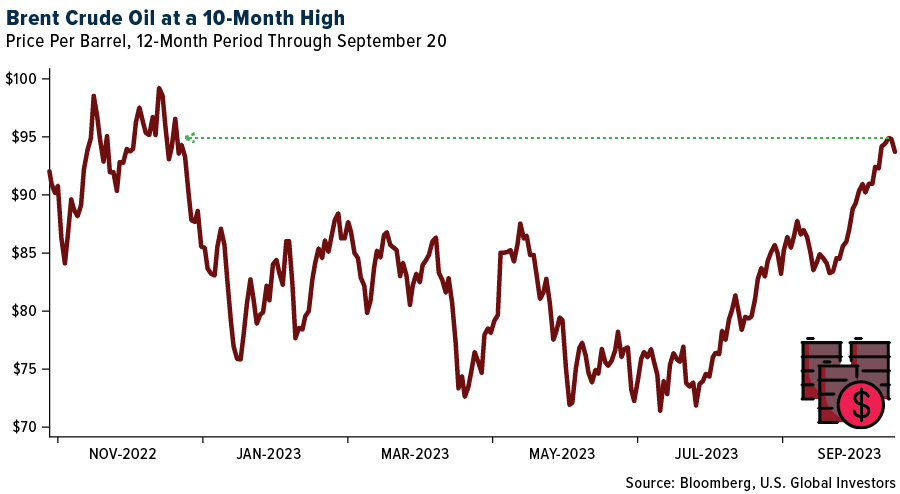
As Brent crude edges closer to the symbolic threshold of $100 per barrel, nations and industries around the world are bracing for the impact.
The surge to nearly $95 this week marks a 10-month high due to a bullish market pattern and supply cuts from the Organization of Petroleum Exporting Countries and Russia (OPEC+), now extended until at least the end of the year.

While this spike is fueling inflationary pressures globally, its impact will not be evenly distributed. Below I’ll examine which countries and regions are most vulnerable to these rising oil prices and what that could mean for the global economy.
How OPEC’s Supply Cuts Could Usher In $100 Oil
OPEC’s—and, notably, Saudi Arabia’s—continued reluctance to increase supply has constricted the oil market, and coupled with cautious economic optimism in major economies like the U.S., the asset may be ready to tip into the triple digits per barrel.
At least, that’s what hedge funds appear to believe right now, with the number of net long contracts jumping to an 18-month high, according to the Financial Times.
A recent Wood Mackenzie (WoodMac) report further suggests that we may be staring down the barrel (no pun intended) of sustained high oil prices. Forecasting $90 per barrel crude in 2024, WoodMac analysts believe OPEC+ will increase production slowly over the next two years.
The implications for oil-dependent economies are noteworthy.
So Who’s Most At Risk?
Last month, independent research firm Euromonitor International unveiled its Global Energy Vulnerability Index, aimed at assessing countries based on factors such as energy self-sufficiency, alternative energy adoption and economic resilience.
High-production nations like Norway, Canada, Australia and the U.S. scored high due to their diverse energy portfolios and economic stability, while resource-poor countries like Belarus, Lebanon, Singapore and Hong Kong were flagged as vulnerable due to their reliance on imports and other economic factors.
Euromonitor was looking at all forms of energy, including not just oil but also other fossil fuels (coal and natural gas) as well as renewables (wind and solar, primarily).
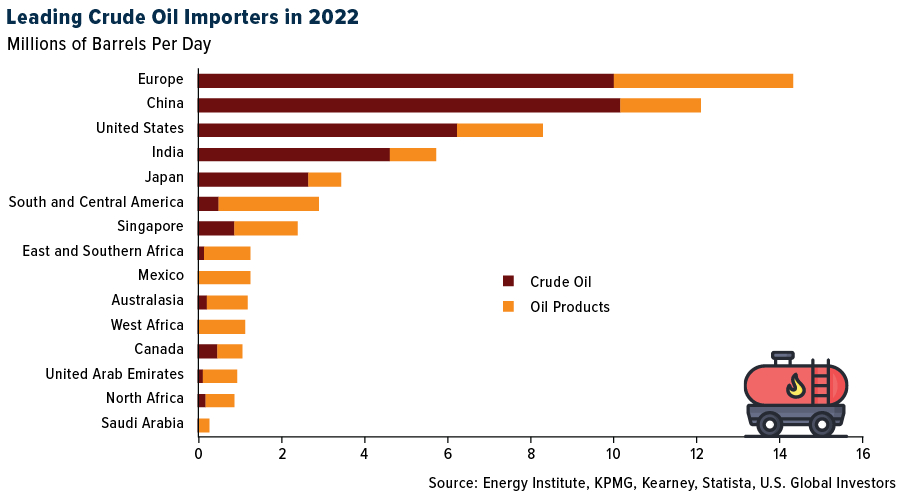
For data on oil alone, I turned to the Energy Institute’s 2023 Statistical Review of World Energy.

Developed Economies:
Europe: With crude oil imports of over 10 million barrels per day in 2022, Europe stands to be severely impacted by rising oil prices. The European Central Bank (ECB) will face the challenge of battling inflation without stifling growth.
Japan: Japan’s import figures stand at around 2 million barrels per day. Despite its technological prowess, Japan lacks energy resources, making it significantly vulnerable to fluctuations in the oil market.
Emerging Economies:
China: China imported slightly more oil than all of Europe per day in 2022, making it highly susceptible to rising oil prices. Its impact could spill over into global manufacturing and supply chains.
India: Importing 4 million barrels per day, India is another major player whose economy could feel the heat. Higher oil prices often translate into inflationary pressures in India, affecting millions of households.
Others:
Singapore: Despite being a developed, high-income nation, the Asian city-state’s economy could take a hit due to its high dependency on energy imports, standing at 891,000 barrels per day.
As Brent crude hovers around the $95 mark, countries dependent on oil imports must prepare for economic headwinds. The rise in oil prices—though favorable for oil-exporting nations like Norway, Qatar and Nigeria—serves as a warning bell for countries heavily reliant on oil imports. Diversification of energy resources and enhancing economic resilience will end up being key strategies moving forward.
Which countries produce the most oil? Find out by watching the video!
—
Originally Posted September 21, 2023 – Which Countries Are Most (And Least) Vulnerable To $100 Per Barrel Oil?
All opinions expressed and data provided are subject to change without notice. Some of these opinions may not be appropriate to every investor. By clicking the link(s) above, you will be directed to a third-party website(s). U.S. Global Investors does not endorse all information supplied by this/these website(s) and is not responsible for its/their content.
The Global Energy Vulnerability Index 2023 is designed to help leaders and businesses assess and benchmark a country’s energy security, providing insights into potential risks, challenges and opportunities in the markets where they operate or plan to expand into in the future.
Disclosure: US Global Investors
All opinions expressed and data provided are subject to change without notice. Holdings may change daily.
Some of these opinions may not be appropriate to every investor. By clicking the link(s) above, you will be directed to a third-party website(s). U.S. Global Investors does not endorse all information supplied by this/these website(s) and is not responsible for its/their content.
About U.S. Global Investors, Inc. – U.S. Global Investors, Inc. is an investment adviser registered with the Securities and Exchange Commission (“SEC”). This does not mean that we are sponsored, recommended, or approved by the SEC, or that our abilities or qualifications in any respect have been passed upon by the SEC or any officer of the SEC.
This commentary should not be considered a solicitation or offering of any investment product.
Certain materials in this commentary may contain dated information. The information provided was current at the time of publication.
Some links above may be directed to third-party websites. U.S. Global Investors does not endorse all information supplied by these websites and is not responsible for their content.
Please consider carefully a fund’s investment objectives, risks, charges and expenses. For this and other important information, obtain a fund prospectus by clicking here or by calling 1-800-US-FUNDS (1-800-873-8637). Read it carefully before investing. Foreside Fund Services, LLC, Distributor. U.S. Global Investors is the investment adviser.
Disclosure: Interactive Brokers Third Party
Information posted on IBKR Campus that is provided by third-parties does NOT constitute a recommendation that you should contract for the services of that third party. Third-party participants who contribute to IBKR Campus are independent of Interactive Brokers and Interactive Brokers does not make any representations or warranties concerning the services offered, their past or future performance, or the accuracy of the information provided by the third party. Past performance is no guarantee of future results.
This material is from US Global Investors and is being posted with its permission. The views expressed in this material are solely those of the author and/or US Global Investors and Interactive Brokers is not endorsing or recommending any investment or trading discussed in the material. This material is not and should not be construed as an offer to buy or sell any security. It should not be construed as research or investment advice or a recommendation to buy, sell or hold any security or commodity. This material does not and is not intended to take into account the particular financial conditions, investment objectives or requirements of individual customers. Before acting on this material, you should consider whether it is suitable for your particular circumstances and, as necessary, seek professional advice.
Disclosure: Futures Trading
Futures are not suitable for all investors. The amount you may lose may be greater than your initial investment. Before trading futures, please read the CFTC Risk Disclosure. A copy and additional information are available at ibkr.com.


Join The Conversation
For specific platform feedback and suggestions, please submit it directly to our team using these instructions.
If you have an account-specific question or concern, please reach out to Client Services.
We encourage you to look through our FAQs before posting. Your question may already be covered!