The U.S. is adding new renewable energy capacity at a record clip, but that doesn’t mean it’s ready to quit fossil fuels just yet. The country just became the world’s biggest exporter of liquefied natural gas (LNG) for the first time ever, with last year’s shipments hitting an unprecedented 91.2 million metric tons, exceeding top suppliers Australia and Qatar.
The surge in LNG exports, primarily driven by Freeport LNG’s return to full service and robust global demand, particularly from Europe, signifies America’s pivotal role in the global energy market.
The U.S. also remains the world’s largest oil producer. In October, the energy powerhouse generated a staggering 13.25 million barrels per day, marking only the fourth month on record that the country met or surpassed 13 million barrels per day on average.
Updated Period Table Of Commodities Returns
It’s against this backdrop that we share with you our always-popular, interactive Periodic Table of Commodities Returns,updated to reflect 2023 data.
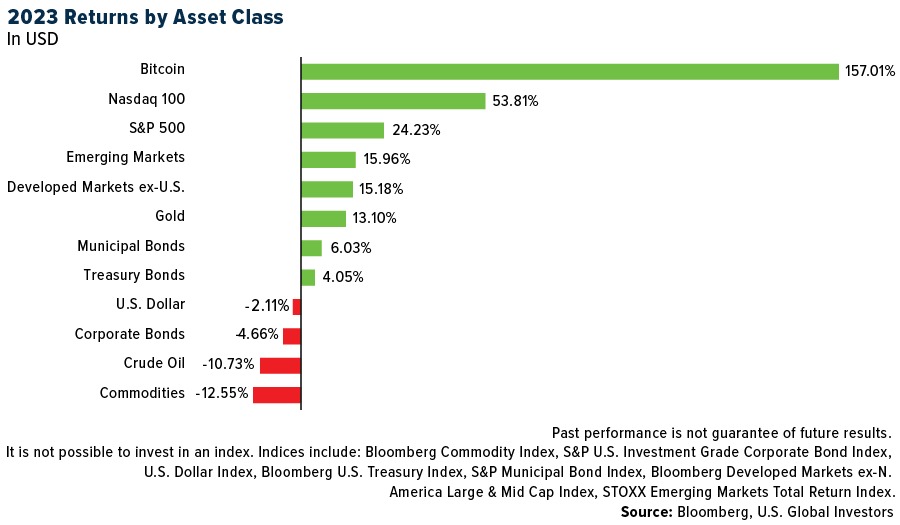
Commodities as a whole had a challenging year, with the group finishing down 12.55% due to a number of factors, including rising rates, recession fears and China’s disappointing pandemic reopening.
Excess supply contributed to the drawdown. Despite strong global demand, the price of natural gas plunged nearly 44%, its worst year in at least a decade, largely as a result of record-high production. According to the Energy Information Administration (EIA), the U.S. produced an astonishing 104.9 billion cubic feet per (Bcf/d), a new monthly high.
After topping the list of commodities in the previous two years, lithium prices cratered for very much the same reason in 2023. This, combined with news that Americans’ appetite for electric vehicles (EVs) may be waning, drove the battery metal down to prices last seen in summer 2021.
I believe these lower prices set up an attractive buying opportunity. Commodities are the building blocks of everything we use and enjoy on a daily basis, and as the global population expands, so too does demand for these materials. The Minerals Education Coalition (MEC) estimates that every American born in 2023 will require over 3 million pounds of metals, minerals and fuels over the course of their lifetime. Last year alone, over 40,000 pounds of raw materials, from cement to sand to aluminum, were needed for every person in the U.S.
Gold Took The Crown
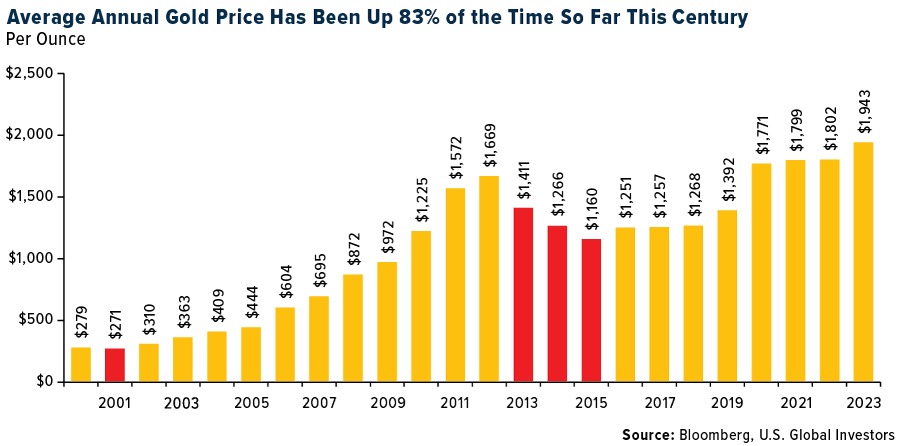
Gold was the number one commodity and only one of two that finished the year in the black, copper being the other commodity (just barely). The precious metal rose 13.10% to close the year above $2,000 per ounce for the very first time, and with an average 2023 price of $1,943, it managed to notch its eighth straight annual gain. Gold has now advanced in 20 of the past 24 years, or 83% of the time.
Looking ahead to the end of 2024, I believe we’ll see a fresh boost in gold’s investment case once the Federal Reserve begins trimming rates. Support should also come from central banks, which bought a record amount of gold in the first nine months of the year. Financial institutions purchased a net 800 metric tons from January to September 2023, a 14% increase from the same period in 2022, according to the World Gold Council (WGC).
China easily led all other countries, accumulating 181 tons of gold in the first nine months, as it seeks to prop up its currency and diversify away from the U.S. dollar. The WGC estimates that gold now represents just 4.3% of the country’s total foreign reserves, compared to nearly 70% for the U.S. If China were to get to America’s level, it would need to buy an additional 33,810 metric tons, which is 10 times more gold than the entire world produced in 2022.
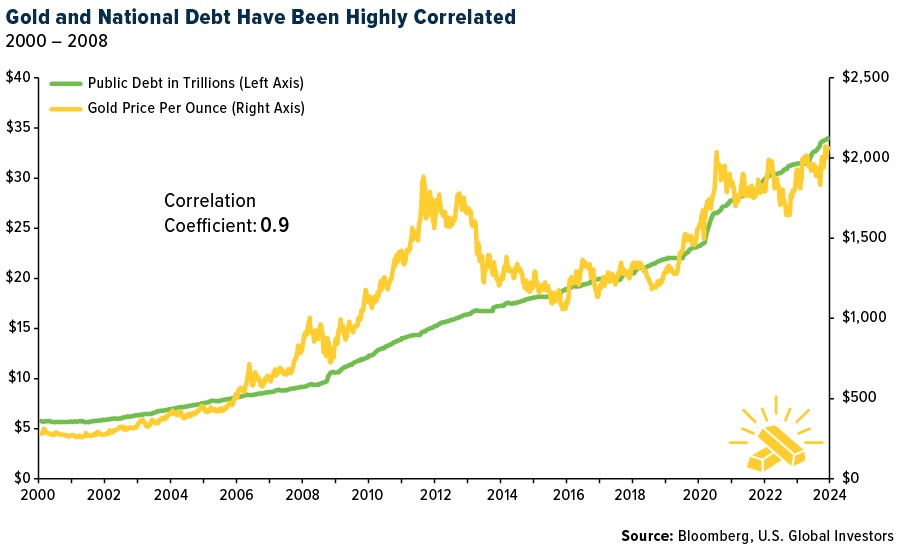
Before moving on, I’d like to point out that U.S. national debt just crossed above $34 trillion for the first time, the equivalent of $101,000 per U.S. citizen, or $264,000 per taxpayer. I believe this is a good place to look if you want to know where gold may be headed in the coming months and years. Since the start of this century, national debt and gold have shared a strong positive correlation coefficient of 0.9. In simple terms, this means that both have tended to make similar moves day-to-day. If you think debt is headed higher, it may make sense to consider an investment in physical gold and gold mining stocks.
Solar Market’s Unprecedented Growth In 2023
On the energy side, the renewable energy market saw significant strides in 2023, with over 440 gigawatts of added capacity. Notably, both the U.S. and Europe set new benchmarks for solar installations, while China’s contributions dwarfed everyone else’s, adding between 180 and 230 gigawatts (GW).
Wood Mackenzie, however, forecasts a slowdown in the growth rate of annual solar installations this year. Despite this, the global solar market remains substantially larger than it was a few years ago, following a typical S-curve pattern of rapid growth followed by gradual maturation. This build-out is expected to benefit silver in particular, a key mineral found in photovoltaic (PV) panels.
A Word On The Election
On a final note, 2024 is an election year, and it appears more and more likely that we’ll have a second rematch between incumbent president Joe Biden and Donald Trump. I expect to see heightened vitriol and animus this year compared to past cycles, given that both men are deeply unpopular and facing either criminal charges or an impeachment inquiry.
As unpleasant as this election is shaping up to be, I don’t predict substantial effects on the market. Believe it or not, the S&P 500 has never declined in a presidential re-election year, and historical data doesn’t support the notion that election outcomes profoundly influence U.S. stock market returns over the long term. Other factors are more crucial in driving stock market trends.
Therefore, I advise that investors concentrate on underlying economic conditions. In an election year, the most effective investment strategy, in my view, is to maintain a diversified portfolio instead of pursuing short-term, tactical bets.
Visit the updated Periodic Table of Commodities Returns, updated for 2023, by clicking here!
—
Originally Posted January 8, 2024 – 2023 Commodities Report: Winners And Losers In The Global Market
All opinions expressed and data provided are subject to change without notice. Some of these opinions may not be appropriate to every investor. By clicking the link(s) above, you will be directed to a third-party website(s). U.S. Global Investors does not endorse all information supplied by this/these website(s) and is not responsible for its/their content.
The S&P 500 is widely regarded as the best single gauge of large-cap U.S. equities and serves as the foundation for a wide range of investment products. The index includes 500 leading companies and captures approximately 80% coverage of available market capitalization. The NASDAQ-100 Index is a modified capitalization-weighted index of the 100 largest and most active non-financial domestic and international issues listed on the NASDAQ. No security can have more than a 24% weighting. The Bloomberg Commodity Index is calculated on an excess return basis and reflects commodity futures price movements. The index rebalances annually weighted 2/3 by trading volume and 1/3 by world production and weight-caps are applied at the commodity, sector and group level for diversification. The S&P Investment Grade Corporate Bond Index seeks to measure the performance of U.S. corporate debt issued by constituents in the S&P 500 with an investment-grade rating. The U.S. Dollar Index indicates the general int’l value of the USD. The USDX does this by averaging the exchange rates between the USD and major world currencies. The Bloomberg U.S. Treasury Index measures U.S. dollar-denominated, fixed-rate, nominal debt issued by the U.S. Treasury. The S&P Municipal Bond Index is a broad, comprehensive, market value-weighted index following bond issues that are exempt from U.S. federal income taxes or subject to the alternative minimum tax. The Bloomberg Developed Markets ex N. America Large & Mid Cap Price Return Index is a float market-cap-weighted equity benchmark that covers 85% market cap of the measured market. The STOXX Emerging Markets Total Market Index represents the performance of the world’s emerging markets as a whole. It covers about 95% of the free-float market cap of the relevant investable stock universe by region or country.
Holdings may change daily. Holdings are reported as of the most recent quarter-end. None of the securities mentioned in the article were held by any accounts managed by U.S. Global Investors as of 9/30/2023.
Disclosure: US Global Investors
All opinions expressed and data provided are subject to change without notice. Holdings may change daily.
Some of these opinions may not be appropriate to every investor. By clicking the link(s) above, you will be directed to a third-party website(s). U.S. Global Investors does not endorse all information supplied by this/these website(s) and is not responsible for its/their content.
About U.S. Global Investors, Inc. – U.S. Global Investors, Inc. is an investment adviser registered with the Securities and Exchange Commission (“SEC”). This does not mean that we are sponsored, recommended, or approved by the SEC, or that our abilities or qualifications in any respect have been passed upon by the SEC or any officer of the SEC.
This commentary should not be considered a solicitation or offering of any investment product.
Certain materials in this commentary may contain dated information. The information provided was current at the time of publication.
Some links above may be directed to third-party websites. U.S. Global Investors does not endorse all information supplied by these websites and is not responsible for their content.
Please consider carefully a fund’s investment objectives, risks, charges and expenses. For this and other important information, obtain a fund prospectus by clicking here or by calling 1-800-US-FUNDS (1-800-873-8637). Read it carefully before investing. Foreside Fund Services, LLC, Distributor. U.S. Global Investors is the investment adviser.
Disclosure: Interactive Brokers Third Party
Information posted on IBKR Campus that is provided by third-parties does NOT constitute a recommendation that you should contract for the services of that third party. Third-party participants who contribute to IBKR Campus are independent of Interactive Brokers and Interactive Brokers does not make any representations or warranties concerning the services offered, their past or future performance, or the accuracy of the information provided by the third party. Past performance is no guarantee of future results.
This material is from US Global Investors and is being posted with its permission. The views expressed in this material are solely those of the author and/or US Global Investors and Interactive Brokers is not endorsing or recommending any investment or trading discussed in the material. This material is not and should not be construed as an offer to buy or sell any security. It should not be construed as research or investment advice or a recommendation to buy, sell or hold any security or commodity. This material does not and is not intended to take into account the particular financial conditions, investment objectives or requirements of individual customers. Before acting on this material, you should consider whether it is suitable for your particular circumstances and, as necessary, seek professional advice.
Disclosure: Futures Trading
Futures are not suitable for all investors. The amount you may lose may be greater than your initial investment. Before trading futures, please read the CFTC Risk Disclosure. A copy and additional information are available at ibkr.com.




Join The Conversation
For specific platform feedback and suggestions, please submit it directly to our team using these instructions.
If you have an account-specific question or concern, please reach out to Client Services.
We encourage you to look through our FAQs before posting. Your question may already be covered!