
- Solve real problems with our hands-on interface
- Progress from basic puts and calls to advanced strategies
Interactive Options Course
Posted June 17, 2026 at 12:56 pm
Stocks are climbing cautiously ahead of this afternoon’s Fed decision as better-than-expected economic data sparked some early buying. The Dow Jones reached another fresh record after a pair of beats on retail activity and pending home sales signaled that the consumer remains on firm footing while pointing to a modest improvement in the ailing real estate industry. The stronger-than-anticipated figures are lifting the cyclical outlook just a few hours before US central bank Chair Kevin Warsh delivers his first presser as the head of the monetary policy institution. Investors have dialed down their hawkish assumptions in light of crude oil diving to more than a three-month low from back in the beginning of March, as the risk of heavier fuel costs spreading across the economy has been contained at this juncture. Still, yields and the greenback are nearly flat this session as fixed-income and currency observers await the release of the dot-plot and its accompanying statements and commentary. All major equity benchmarks are advancing; however, only half of the sectors are green, and volatility protection instruments are experiencing demand, reflecting hesitation on behalf of traders to materially raise exposures prior to the main event. Elsewhere, overall commodities and prediction markets are catching bids, but cryptocurrencies are retreating.
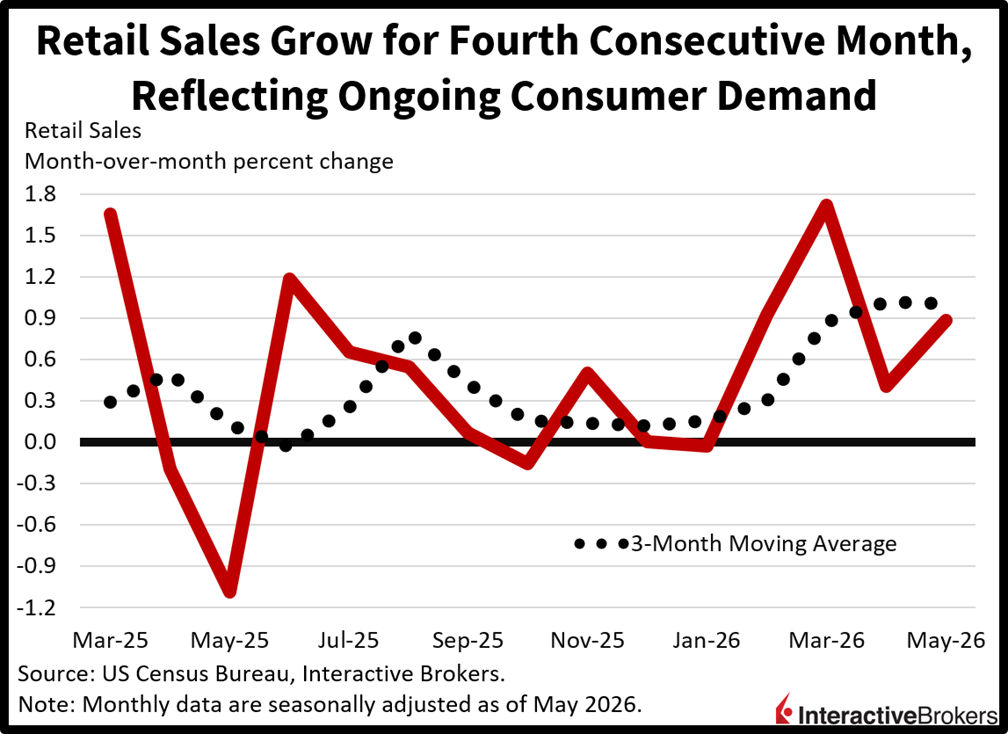
Retail sales grew for the fourth consecutive month in May as consumers reflect resilience amidst elevated inflation and lofty interest rates. The headline figure expanded 0.9% month over month (m/m), exceeding the 0.5% expectation and accelerating from 0.4% in April. Of the 13 major categories, 9 posted gains, with gasoline stations, miscellaneous retailers, ecommerce, automobile dealerships and furniture showrooms seeing transactions rise 3.4%, 2.3%, 1.5%, 1.2%, and 1% m/m. The health/personal care, general merchandise, apparel and sporting goods categories saw more modest increases, meanwhile. Conversely, electronics/appliance destinations and restaurants/bars experienced declines of 0.5% and 0.1%, while building materials and food markets were unchanged.
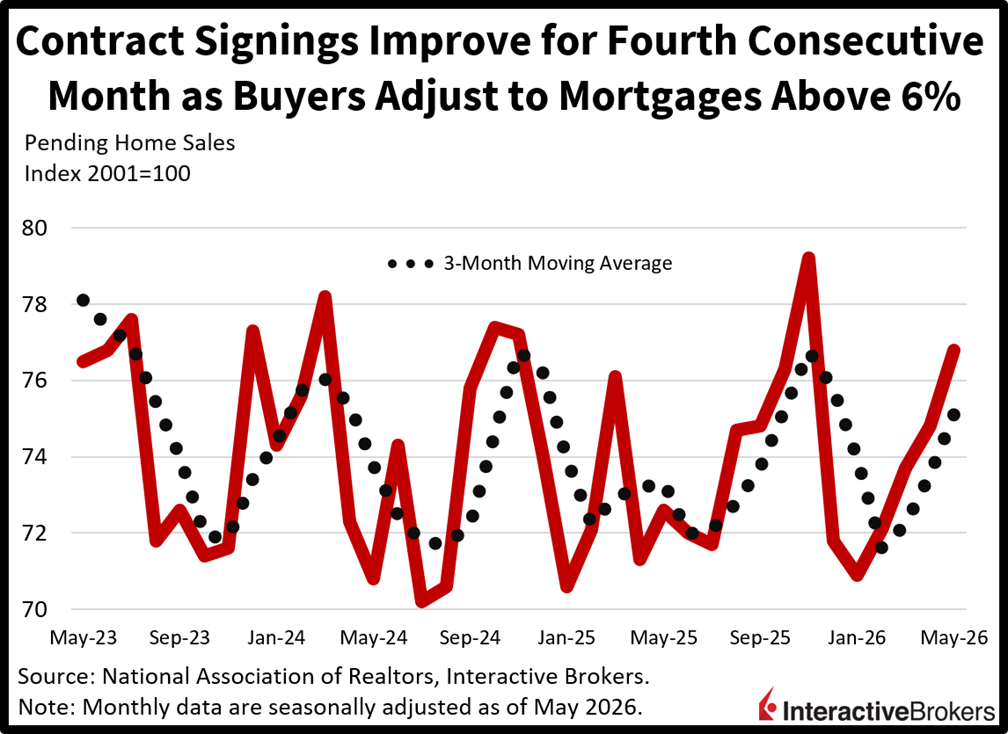
Pending home sales also posted a fourth straight month of growth while surpassing the economist consensus estimate as prospective buyers are learning to live with mortgages above 6%. The 3.8% m/m headline growth was significantly stronger than the 0.8% expected and the 0.3% print in April. Similarly, this report depicted broad strength as well, with all regions expanding m/m and year over year (y/y). Indeed, the Northeast, Midwest, South and West expanded 8.7%, 8.1%, 1% and 0.7% m/m while the overall number rose 4.8% y/y. This gauge is considered a leading indicator to residential closings, as contracts are typically signed roughly 30 days before financing is complete and keys are exchanged.
With stocks nearing records, yields plunging in the past few days and a lack of hedging interest on Wall Street, markets aren’t ready for a hawkish Kevin Warsh this afternoon. While it’s unlikely that the new Chair will signal an imminent need for tighter policy, statements that reflect unease about inflationary figures that have stayed above the official target for more than five years and/or comments suggesting a high likelihood of hikes at upcoming meetings could certainly startle investors that have gotten used to a central bank that has generally fostered smooth-sailing for most of the Powell era. Such a development would spark turbulence in risk assets and Treasurys as traders consider a regime shift consisting of greater monetary discipline as it relates to cost forces amidst a heavier focus on a leaner balance sheet. But the potential outcome with the highest chance of occurring, in my view, is a tempered leader that cheers the recent slide in crude oil and signals patience as price pressures begin their retreat back to 3%. Only time will tell if that’s good enough.
The UK Consumer Price Index climbed 2.8% y/y and 0.2% m/m in May. The yearly rate was cooler than the economist consensus prediction for a 3% climb and matched the April result. The m/m metric, furthermore, eased from 0.7% in April and was lower than the economist consensus expectation for a 0.4% hike. The core CPI, which strips out items with volatile pricing, was also cooler than expected. Its 2.6% y/y result climbed from 2.5% in April but fell below the 2.7% economist consensus forecast. The core gauge also eased m/m with the 0.3% print lower than 0.7% in April and below the 0.4% economist forecast.
The Japan Reuters Tankan Index climbed from 8 in May to 13 this month, reflecting improving sentiment among manufacturers who are benefiting from growing exports resulting from demand for artificial technology products and other high-tech items. According to Reuters, the gauge for chemical companies climbed from 6 to 20 in response to strong order requests from semiconductor manufacturers. Conversely, the transport machinery sector sank from 13 to -13. Businesses reported difficulties with sourcing raw materials due to geopolitical tensions. The monthly index is designed to provide an early indication of the Bank of Japan’s quarterly Tankan Index.
Core machinery orders in Japan climbed 8.7% m/m and 15.6% y/y in April, surpassing both the economist consensus estimates of 1.2% and 9.3%, according to the Cabinet Office. Order flow reversed from the 9.4% m/m March slip. It also accelerated from the 5.9% y/y March expansion.
Japan’s struggling yen resulted in the country’s global trade producing a ¥378.7 billion (or approximately$2.36 billion) deficit last month, a strong reversal from the ¥299 billion April surplus. On a positive note, the deficit was lower than the ¥564 billion anticipated by a consensus of analysts. The value of imports climbed by 12.5% y/y in May, missing the 12.8% economist consensus estimate but expanding at a faster pace than in April, when the value of shipments abroad was up 9.8%. The large gain was a result of a weaker yen as imports by volume contracted during the months. The country’s currency is down approximately 10% y/y relative to the US dollar. Exports, meanwhile, were 17% higher than during the same year-ago period, which outpaced the economist consensus estimate of 16.2% and the preceding month’s 14.8% y/y climb.
Singapore’s ex-oil trade balance fell from a surplus of S$13.13 billion in April to S$5.57 billion last month despite non-oil exports jumping 38.4% y/y, according to Enterprise Singapore. The stellar northward movement in the value of items shipped abroad blew past the economist consensus estimate of 30% and accelerated from 24.4% in the preceding month. The y/y metric was largely driven by robust demand for AI-related items as non-oil exports minus electronics were up only 17.7% y/y. Relative to April, however, exports were up only 7.7%, a weaker result than the preceding month’s 11% m/m gain. Among markets, the US ramped up its purchases of electronics the most with a 303% y/y ascent. Taiwan, South Korea and India followed with growth hitting 218%, 175.5% and 74.9%.
New to Interactive Brokers?
Open AccountInformation posted on IBKR Campus that is provided by third-parties does NOT constitute a recommendation that you should contract for the services of that third party. Third-party participants who contribute to IBKR Campus are independent of Interactive Brokers and Interactive Brokers does not make any representations or warranties concerning the services offered, their past or future performance, or the accuracy of the information provided by the third party. Past performance is no guarantee of future results.
This material is from IBKR Macroeconomics, an affiliate of Interactive Brokers LLC, and is being posted with its permission. The views expressed in this material are solely those of the author and/or IBKR Macroeconomics and Interactive Brokers is not endorsing or recommending any investment or trading discussed in the material. This material is not and should not be construed as an offer to buy or sell any security. It should not be construed as research or investment advice or a recommendation to buy, sell or hold any security or commodity. This material does not and is not intended to take into account the particular financial conditions, investment objectives or requirements of individual customers. Before acting on this material, you should consider whether it is suitable for your particular circumstances and, as necessary, seek professional advice.
Futures, event contracts, and forecast contracts are not suitable for all investors. Before trading these products, please read the CFTC Risk Disclosure. For a copy, visit our Warnings and Disclosures Page.
Trading in digital assets, including cryptocurrencies, is especially risky and is only for individuals with a high risk tolerance and the financial ability to sustain losses. Eligibility to trade in digital asset products may vary based on jurisdiction.
There is a substantial risk of loss in foreign exchange trading. The settlement date of foreign exchange trades can vary due to time zone differences and bank holidays. When trading across foreign exchange markets, this may necessitate borrowing funds to settle foreign exchange trades. The interest rate on borrowed funds must be considered when computing the cost of trades across multiple markets.
Spot currencies are not available at IBKR Singapore.
Related Articles


Join The Conversation
For specific platform feedback and suggestions, please submit it directly to our team using these instructions.
If you have an account-specific question or concern, please reach out to Client Services.
We encourage you to look through our FAQs before posting. Your question may already be covered!