What’s Next for the S&P 500?
Investopedia is partnering with CMT Association on this newsletter. The contents of this newsletter are for informational and educational purposes only, however, and do not constitute investing advice. The guest authors, which may sell research to investors, and may trade or hold positions in securities mentioned herein do not represent the views of CMT Association or Investopedia. Please consult a financial advisor for investment recommendations and services.
What’s Next for the S&P 500?
What’s your take on the S&P 500 as we wrap up 2024? Are you bullish, anticipating the index surging past 6000 before year’s end? Or do the recent signs of elevated volatility, breadth divergences, and other red flags have you more cautious, thinking Q4 might bring a downturn? Let’s explore the possibilities.
First, we’re here to stretch our thinking beyond biases by considering a range of scenarios for the S&P 500. By doing so, we open ourselves to the full spectrum of outcomes—whether extremely bullish or bearish. Second, I’ll guide you in deciding which scenario aligns most with your view, so you can prepare your portfolio accordingly. But remember: staying flexible is key, as any of these scenarios could become reality.
Our Game Plan and Market Context
I’ll lay out four potential scenarios for the S&P 500, each with specific conditions, key levels, and signals to watch. Think about these scenarios, and be sure to drop a comment below to share which one you think is most likely and why!
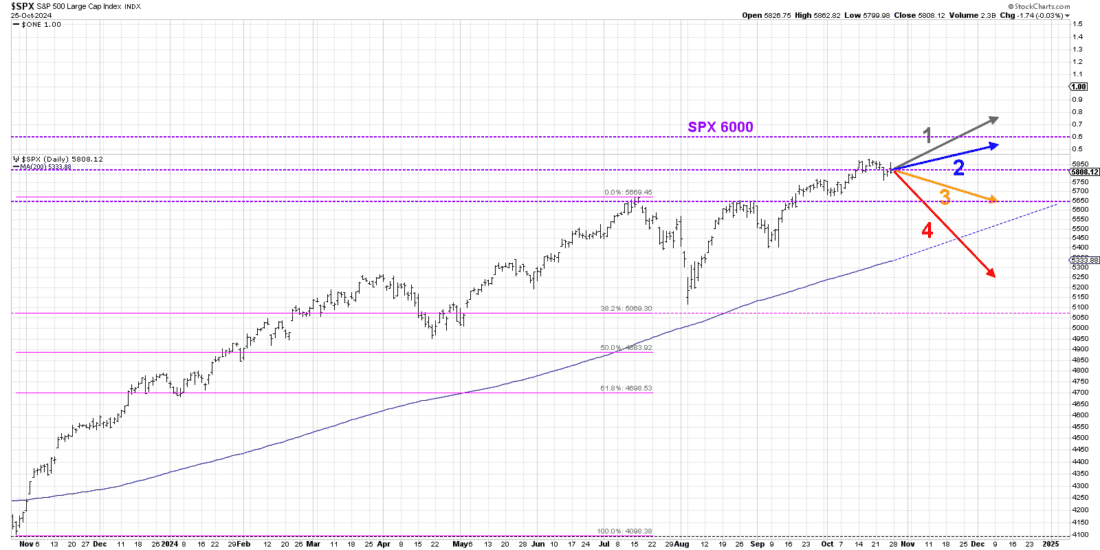
Let’s start with a quick look back. Over the past year, the S&P 500 has remained in an almost relentless uptrend with minimal pullbacks. The biggest drawdown, from the July peak to an early August low, was less than 10%! Since hitting that low in August, we’ve observed three straight months of strength into October. So, what’s next? Let’s review these four potential scenarios.
Scenario One: The Super Bullish Case
This scenario envisions a steady continuation of the trend off the August low, with the S&P climbing higher into December. If this pace holds, we could break above 6000 by early December, potentially setting new all-time highs. This would echo the low-volatility, consistent gains we experienced in Q1. Key signals to watch include a series of higher highs and lows and sustained momentum.
Scenario Two: The Mildly Bullish Case
In the mildly bullish scenario, the S&P 500 edges higher, but struggles to cross the 6000 threshold. We may see resistance due to psychological price barriers, valuation concerns, or underwhelming earnings reports. This scenario would likely see the S&P hovering around 5900-5950, with market breadth indicators possibly weakening—a signal that could set the stage for a more pronounced correction heading into year-end.

Courtesy of StockCharts.com
Scenario Three: The Mildly Bearish Case
Here, the market loses momentum without breaking down entirely. In this scenario, the S&P pulls back slightly but holds above the critical 5650 level and stays above the 200-day moving average. This would imply continued long-term strength, even as short-term caution creeps in. But if the Magnificent 7 names experience any sort of drawdown into November, a scenario like this becomes much more likely.
Scenario Four: The Super Bearish Case
In the most bearish outcome, we see a significant downturn reminiscent of late 2018, with a powerful downtrend emerging in Q4. This scenario would mean a break below both 5650 and the 200-day moving average. As institutions pivot to defensive plays, sectors like utilities, real estate, and consumer staples might start to lead the market.
As we look to early December, earnings reports, the U.S. elections, Federal Reserve announcements, economic data, and global events will all shape the S&P’s path.
So, where do you stand? Do you see a super bullish rally continuing? A mild move up or down? Or a more bearish turn for Q4? Drop your thoughts below with your reasoning—what indicator or driver do you think will trigger your chosen scenario?
—-
Originally posted 31st October 2024
Disclosure: Investopedia
Investopedia.com: The comments, opinions and analyses expressed herein are for informational purposes only and should not be considered individual investment advice or recommendations to invest in any security or to adopt any investment strategy. While we believe the information provided herein is reliable, we do not warrant its accuracy or completeness. The views and strategies described on our content may not be suitable for all investors. Because market and economic conditions are subject to rapid change, all comments, opinions and analyses contained within our content are rendered as of the date of the posting and may change without notice. The material is not intended as a complete analysis of every material fact regarding any country, region, market, industry, investment or strategy. This information is intended for US residents only.
Disclosure: Interactive Brokers Third Party
Information posted on IBKR Campus that is provided by third-parties does NOT constitute a recommendation that you should contract for the services of that third party. Third-party participants who contribute to IBKR Campus are independent of Interactive Brokers and Interactive Brokers does not make any representations or warranties concerning the services offered, their past or future performance, or the accuracy of the information provided by the third party. Past performance is no guarantee of future results.
This material is from Investopedia and is being posted with its permission. The views expressed in this material are solely those of the author and/or Investopedia and Interactive Brokers is not endorsing or recommending any investment or trading discussed in the material. This material is not and should not be construed as an offer to buy or sell any security. It should not be construed as research or investment advice or a recommendation to buy, sell or hold any security or commodity. This material does not and is not intended to take into account the particular financial conditions, investment objectives or requirements of individual customers. Before acting on this material, you should consider whether it is suitable for your particular circumstances and, as necessary, seek professional advice.


Join The Conversation
For specific platform feedback and suggestions, please submit it directly to our team using these instructions.
If you have an account-specific question or concern, please reach out to Client Services.
We encourage you to look through our FAQs before posting. Your question may already be covered!