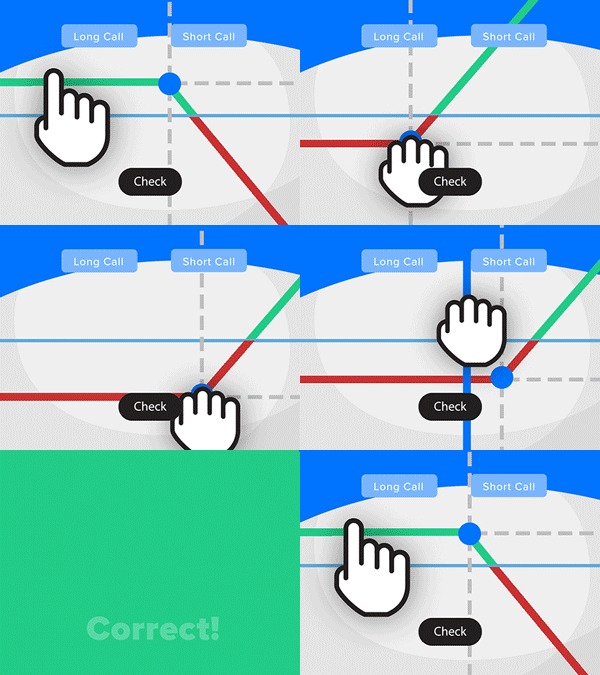
- Solve real problems with our hands-on interface
- Progress from basic puts and calls to advanced strategies
Interactive Options Course
Posted October 21, 2026 at 12:11 pm
Options open interest can reveal valuable information about market activity, but what does it actually tell traders? Jeff Praissman is joined by Market Chameleon’s Dmitry Pargamanik and Will McBride to explore how open interest differs from trading volume, what unusual activity may signal, and the common misconceptions traders should avoid.
The following is a summary of a live audio recording and may contain errors in spelling or grammar. Although IBKR has edited for clarity no material changes have been made.
Hey everyone, this is Jeff Praissman with Interactive Brokers, and it’s my pleasure to welcome back to the IBKR studio Will McBride and Dmitry Pargamanik from Market Chameleon. Hey guys, how are you?
Hey, Jeff, how are you? Thanks for having us.
My pleasure. Love having you guys come in. We just finished up a great webinar, and now we have Will and Dmitry from Market Chameleon come by our podcast studio, as they do every month, to, I’d say, maybe not a deeper dive, but maybe a different dive on a topic. And even before we kick this off, for our listeners, Will and Dmitry run a show every trading day on YouTube. It’s from 9:00 to 9:30, right guys?
Yep. In the morning at 9:00 AM, we do a YouTube channel show. It’s free. Anybody can join, and we discuss options and trading strategies. A lot of times, it’s answering questions that we get over email, and when we get questions that repeat or are similar, we’ll try to focus on those types of questions.
Yeah, and you can also find out more from Market Chameleon on our website as well, interactivebrokers.com. Click on Education and go to the Campus, and then see lots of great past webinars, podcasts, even articles. So today, guys, we’re gonna talk about open interest. And to kick it off, I always find we have a lot of experienced option traders, but sometimes we also get some new option traders. So it probably makes sense to just ask the question: What is options open interest? And why do so many traders use it when analyzing the market?
Yeah. Thanks, Jeff. So when we look at options contracts, they’re different than a stock because a stock has outstanding shares. So a company issues stock, they have so many outstanding shares, and people start trading them. Options are a little bit different because they don’t have outstanding shares. An option is created when a buyer and seller agree to a contract. So it always starts out as zero, and then when you have a trade that creates a contract, and if that contract doesn’t expire or both traders don’t close out, it creates an open interest, meaning, well, here’s a contract two people agreed upon.
It could be a call or a put on certain strikes, certain expiration. And once they create it through a trade, and before it expires and closes out, it creates an open interest, meaning that contract exists out there, and that gets reported by the Options Clearing Corporation that clears options based on settled trades at the end of the day. And this allows us as traders to see, well, how many contracts, what’s the open interest, and where’s the open interest? Certain calls, puts, certain expirations, certain strikes. And it gives us that opportunity to see how liquid and active, and where that trading interest exists.
And option volume and option open interest are very different terms, but I think a lot of times traders, or maybe newer traders, can really get confused between the two and how and why they’re different.
So what’s the biggest misconception that they have about them and the relationship between the two?
Yeah. That’s also a good question. It’s a bit confusing, especially when you’ve just first started looking at it, and you just assume, well, if there’s a volume of 100 contracts, that has to translate to an open interest of 100. And that’s not how open interest exactly works because open interest looks at existing contracts that haven’t been closed or expired yet.
So if you trade in and out of the same contract, both parties the same day, you could have a large volume. You could keep trading back and forth, have a large volume, but at the end of the day, you traded out of, you closed out of your position, so the next day the open interest could be zero. So you could have lots of volume, and if both sides closed it, the open interest could be zero. But in addition, there are people who have option contracts that they’re carrying in inventory. If they trade out of those contracts, for example, one party closes, a different party opens it but doesn’t close out, that’s like a transfer of interest.
So initially you have two parties to a contract. Then one of the parties sells their contracts to a different party. Well, the open interest still exists because everybody didn’t close out.
So what will happen is you have this volume, but an unchanged open interest because, in actuality, new contracts haven’t been created, just existing contracts changed hands between parties. So it’s important to understand the distinction with volume, which just records trades, transactions, and open interest, which is monitoring our option contracts, existing option contracts growing, decreasing, contracting. That’s what the open interest is. It monitors those contracts that have been open, not yet expired or closed.
So can a large open interest position, can a trader interpret it as bullish or bearish, or is that just too simplistic?
Yeah. Well, the open interest itself may not be interpreted as bullish or bearish. Maybe the underlying trades that led to the open interest could be interpreted as bullish or bearish, depending on looking at the trade and trying to make inferences.
Of course, it’s always impossible to know exactly what the intent was of all the parties because options could be used for trading volatility, not necessarily direction. It could be used for protection. Some people use it for trying to collect yield. So it’s not necessarily a bullish or bearish signal in that sense, or open interest alone. I don’t know if that could just tell you the story because it’s important to know, well, what led to this open interest in the first place?
It could’ve been a large straddle, right? Buying a call and a put on the same strike could lead to higher open interest, but that is more of a volatility or stock movement viewpoint than it is direction. Yeah, so more goes into that than just an open interest number.
Gotcha. And what can traders learn when the open interest increases sharply, rises sharply, however you want to phrase it, but let’s just say the underlying stock barely moves? What can that signal?
Yeah, exactly. That’s a good question, too, because when we look at open interest, we kind of go back and say, “Well, what do we think led to it? Or what caused it?” And sometimes, like you mentioned, it could just be news where there’s a stock movement and that created trading interest, right? So new stock movement, people come in, and then they have their opinions about the news, opinions about the stock valuations. They could express it in options, or there could be hedging speculation.
So that would be correlated with maybe a stock move or a news event, which will explain why all of a sudden there’s a jump in open interest and there’s trading activity. Sometimes we may just see open interest increase, and we can’t explain it based on some kind of event that just happened, right? Like an earnings event or stock news and stock jump.
And that could be something very different that you may wanna look at. It could be somebody hedging an existing position, or somebody did some kind of research and decided to structure a viewpoint using options about something that they think going forward, sometime in the future, using the options to express that viewpoint. So yeah, that all factors in trying to analyze and put the pieces together. What happened on this day? Did something happen that may have caused options trading activity, or is there something else that might potentially be going on?
And are traders able to use open interest trends to identify developing positions rather than isolated trades? Or is that not something they’re able to do?
Yeah. So the way open interest could be interesting is if you’re seeing something building up that could be unusual, where you’re seeing a trend. Maybe it’s an accumulation of, let’s say, calls. It could be on a particular strike, or it could look at a range of strikes that are targeting some kind of upside or at the money. So there could be trends that develop that aren’t typical for this stock that may be worth paying attention to. Especially where you identify the trend and you’re starting to see something that’s looking unusual, and it’s building up over days, maybe over weeks, and it’s very skewed. That could point to something going on, perhaps where people are targeting something for some reason.
Okay. And Dmitry and Will, I’m thinking about open interest, right? So there’s always two sides of it. If it’s increasing, let’s just say it’s this particular call, right? So if that position’s open interest is increasing, someone’s buying it and someone’s selling it. Neither one is closing out a position. It’s a net opening on both sides of it. So in my head, I’m thinking, does it support completely different trading strategies and market views, right? You have, in simplest terms, a bearish and a bullish person. How can that be translated, I guess?
Dmitry Pargamanik: Yeah. And when we’re looking at that, two people can trade an option, but they can have a different viewpoint or way of trading that option. So for example, there could be somebody who wants to buy an option because they think that there’s a probability that option will be in the money and profitable, right? Because there’s a good chance that the stock will go up and cover the cost of that option, and they wanna use an option to express that viewpoint.
But on the other side, it could be a market maker or broker-dealer or somebody selling it that has a completely different viewpoint for why they’re selling that option.
It could be volatility where they think, “Well, even if that happens, I think that the implied volatility of this option is very high, and even if I sell it and create the Black-Scholes model, even if the stock goes up and I hedge that option on the way up, that volatility, that premium that somebody’s paying me is worth it to me because trading the Black-Scholes model, I will be able to scalp that volatility,” right?
Somebody who has a long position may be willing to sell some options premium against that position. Or it could be spreading.
So you could see somebody bidding up an option where market makers are willing to sell it because they have inventory of long options somewhere else, and it just kind of fits into their model. So when we look at options, you could actually, depending on the way people trade, have winners on both sides. That could happen. You could have somebody holding an option where the option value goes up and they’re a winner, and somebody who sold the option and hedged it is a winner as well because of the way they traded their strategy. So that’s a thing about options where you really can have winners on both sides of the trade because they’re doing it for different reasons.
And are there clues that can determine if there’s open interest across multiple strikes? Like, are there clues where they can interpret it as either they may be part of a spread or if it’s just single option movements? How would they look at open interest, kind of deciphering that?
Yeah, you’d have to work backwards from looking at the open interest and the trades that led to that open interest.
So a lot of times where we see open interest increase on multiple strikes could be the result of a multi-leg trade, like a spread.
So you could see a very large spread, like a call spread, where you’re buying one option, selling another option, right? But the open interest increases on both. But that was a spread. That wasn’t necessarily buying or selling of both options. It’s just that’s how it was executed, and that created the open interest. Or we could look at it and see if each of those legs or those options were traded individually, and does it look like more order flow was coming in from the buy side or sell side? What was going on with the option?
I think open interest kind of gives you a number, and then working backwards, well, how do we get to that number? What led to this open interest? Which is also something where it’s part of interpretation and looking at the trades and trying to infer, well, what happened here?
And you’re not gonna always get that exactly right, but there are times where you could make a very good inference.
And how do experienced traders distinguish between, say, meaningful open interest data and/or buildup or decline, actually, whether open interest is increasing or decreasing, and just kind of market noise that might go along with some of that stuff as well?
Dmitry Pargamanik: Yeah, I think each situation could be different there. I don’t know if there’s one exact rule. Some of the ways to compare it are to look at historical metrics for that stock to see if there’s something very unusual going on that we don’t typically see or haven’t seen in history. Or if there is something unusual, can we explain it away? Can it be some news event that we’re anticipating, like earnings, where it’s just some market participants doing things ahead of news, right? Positioning themselves ahead of news.
So I think a lot of things come into play. I don’t think there’s one set rule, but evaluating the surrounding circumstances, looking at historical metrics to see, do we see something very unusual we don’t typically see or haven’t seen in the last two years? Something of that nature. And why would somebody be doing something like that?
It could be a big hedge, could be something of that nature. But sometimes you could see some behavior where you wanna look at it a little bit closer and try to figure out, this might be signaling something going on.
And we kind of talked about spreads before, a couple of questions back, but I’m guessing that’s sort of why open interest can, quote-unquote, migrate from one expiration to another. That may be one reason why you might see, say, open interest in one expiration decrease by almost the same number as open interest in another strike increases in an expiration further down the road.
Are there any other reasons why you might see that kind of open interest migrate except for spreads?
Yeah. So very often people use options as part of a longer-term strategy. It could be their buy-write strategies, their hedging strategies, their volatility strategies, and options are something that expire. They go away. And those strategies could reset to new options.
So oftentimes, the open interest does migrate out to further months as those months come closer to expiration. That does happen in certain securities, like maybe something like a broad-based ETF or one of the very large-cap stocks, where the traders that trade in that space, in that option, will migrate their positions, either their hedges or their particular strategies.
So yeah, we do see that also happening very frequently.
And when traders are studying options activity, how can they separate observable facts from, say, assumptions and market narratives?
Yes. Certain things like market data, those are facts, right? Or we’ll look at earnings coming up, news. Those are observable facts that we know we could factor in. But the intent is not always known of market participants. Why are they buying this stuff? Why are they selling? Are they speculating? Are they looking at volatility? Are they hedging things off? So those we don’t know.
And sometimes, with any data, we start to analyze it, summarize it, and make inferences and assumptions based on this data, based on this information, based on the way things transpired. I’m assuming that there’s more buyers of this option than sellers, and it might be due to the news or something coming up. So yeah, we take observable facts, and from those we start making certain assumptions, educated assumptions, that based on these factors and these trends, we think that this is what’s going on.
Will and Dmitry, this has been great as always. For our listeners, I highly recommend you check out their YouTube show, Before the Market Opens, and also go to our website, interactivebrokers.com. Find great commentary from Market Chameleon, podcasts, past webinars, and so forth. Until next month, guys. Thanks for coming by the IBKR Podcast Studio.
Thanks, Jeff.
New to Interactive Brokers?
The analysis in this material is provided for information only and is not and should not be construed as an offer to sell or the solicitation of an offer to buy any security. To the extent that this material discusses general market activity, industry or sector trends or other broad-based economic or political conditions, it should not be construed as research or investment advice. To the extent that it includes references to specific securities, commodities, currencies, or other instruments, those references do not constitute a recommendation by IBKR to buy, sell or hold such investments. This material does not and is not intended to take into account the particular financial conditions, investment objectives or requirements of individual customers. Before acting on this material, you should consider whether it is suitable for your particular circumstances and, as necessary, seek professional advice.
The views and opinions expressed herein are those of the author and do not necessarily reflect the views of Interactive Brokers, its affiliates, or its employees.
The information provided on MarketChameleon is for educational and informational purposes only. It should not be considered as financial or investment advice. Trading and investing in financial markets involve risks, and individuals should carefully consider their own financial situation and consult with a professional advisor before making any investment decisions. MarketChameleon does not guarantee the accuracy, completeness, or reliability of the information provided, and users acknowledge that any reliance on such information is at their own risk. MarketChameleon is not responsible for any losses or damages resulting from the use of the platform or the information provided therein. The 7-day free trial is offered for evaluation purposes only, and users are under no obligation to continue using the service after the trial period.
Options involve risk and are not suitable for all investors. For information on the uses and risks of options, you can obtain a copy of the Options Clearing Corporation risk disclosure document titled Characteristics and Risks of Standardized Options by going to the following link ibkr.com/occ. Multiple leg strategies, including spreads, will incur multiple transaction costs.













Join The Conversation
For specific platform feedback and suggestions, please submit it directly to our team using these instructions.
If you have an account-specific question or concern, please reach out to Client Services.
We encourage you to look through our FAQs before posting. Your question may already be covered!