
- Solve real problems with our hands-on interface
- Progress from basic puts and calls to advanced strategies
Interactive Options Course

Posted May 6, 2024 at 1:20 pm
Whether you’re a seasoned trader or just starting in quantitative finance, grasping the concept of standard deviation is crucial. Standard deviation helps traders with volatility measures in finance. With this helpful tool, traders can make sense of market fluctuations and manage risks effectively.
In this blog, we break down the idea of standard deviation by imparting all the necessary information related to standard deviation in the trading domain. Let’s dive into the exciting journey of understanding standard deviation’s role in trading as we cover:
Let us see a famous quote defining standard deviation by John Bollinger, a well-known figure in the trading world, primarily recognised for developing the widely-used technical analysis tool known as Bollinger Bands.
“Standard deviation is a key tool for traders to quantify the uncertainty and risk in the market. It allows us to better understand the potential variability of returns and make informed decisions to manage our portfolios effectively.” – John Bollinger
Definition of standard deviation“The standard deviation (σ) is a measure that is used to quantify the amount of variation or dispersion of data from its mean.”
Let’s simplify the concept of deviation from the mean.
In essence, deviation refers to how far a data point is from the average. Imagine we have a set of observations represented by the variable X, consisting of various values: x₁, x₂, …, xn.
Now, let’s consider two of these observations (as shown in the image below), x₁ and x₂, and their deviations from the mean of X.
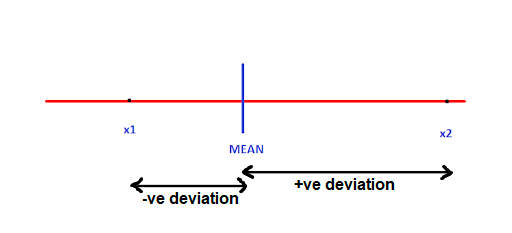
Deviations are straightforward: they tell us if an observation is above or below the mean, shown by positive or negative values respectively.
What if we add up all these deviations?
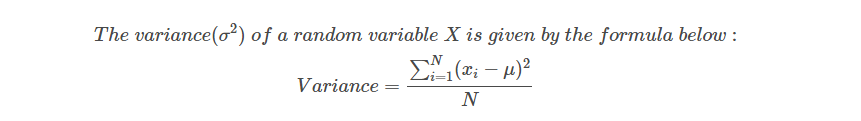
Interestingly, they would balance out to zero due to the mix of positive and negative values. To overcome this, we square each difference to remove the sign and find their average. This yields the variance, indicating how spread out the data is.
Standard deviation, derived from the variance, provides a standardised measure of dispersion. It involves taking the positive square root of the variance. This process ensures we’re dealing with values in the same units as the original data. In the following section, we’ll delve into the formula for calculating standard deviation.⁽¹⁾
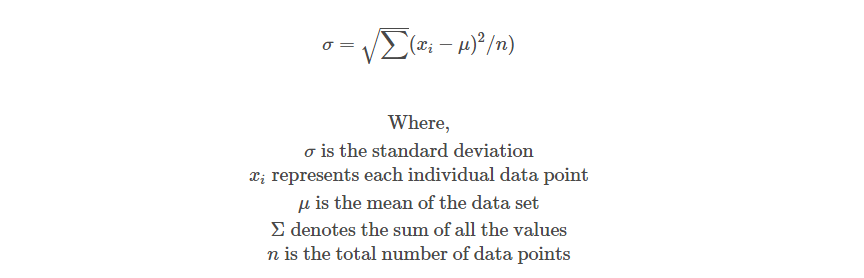
The formula for calculating the standard deviation (denoted by σ) is as follows:
Going forward, we will discuss the calculation of standard deviation.
To calculate the standard deviation using Python, you can utilise libraries such as pandas and numpy. Here’s a step-by-step guide to calculate the standard deviation using historical price data:
If you haven’t already installed numpy, you can install it using pip:
import numpy as np
Import_libraries.py hosted with ❤ by GitHub
Here we have taken an array of numbers to show the calculation.
# Define your data as an array of numbers
data = [10, 15, 20, 25, 30]
Data.py hosted with ❤ by GitHub
Step 3: Compute Standard Deviation
# Compute Standard Deviation
data_std_dev = np.std(data)

print("Standard Deviation of Data:", data_std_dev)
Compute_sd.py hosted with ❤ by GitHub
Output:
Standard Deviation of Data: 7.0710678118654755
We will now discuss some examples of the applications of standard deviation in general as well as in trading.
Let us check out the general examples of applying standard deviation before heading to the trade oriented example.
The term standard deviation sounds like something you hear in a statistics class, but don’t dismiss it as an overly technical term just yet. It can be used in different aspects of our lives.
A teacher can use the standard deviation of marks of her students in an exam as a metric to assess the overall level of understanding of the subject. If the mean and standard deviation are both high, it indicates that, on average, students have a good understanding of the subject.
However, there would be many students who have scores that are much above and much below the average scores. In case the mean is high and the standard deviation is low, it indicates that the average scores are similar to the previous case.
The low standard deviation tells her that most students have scores that are close (i.e. slightly above and slightly below) to the mean. In weather forecasting, it can be used to compare the weather patterns in two or more regions.
If we compare the standard deviation of temperatures in Jaisalmer (which has extreme weather) with Mumbai (which has moderate weather), we would find that the former has more variability in temperature around the mean.
Example: Amazon (AMZN) Stock
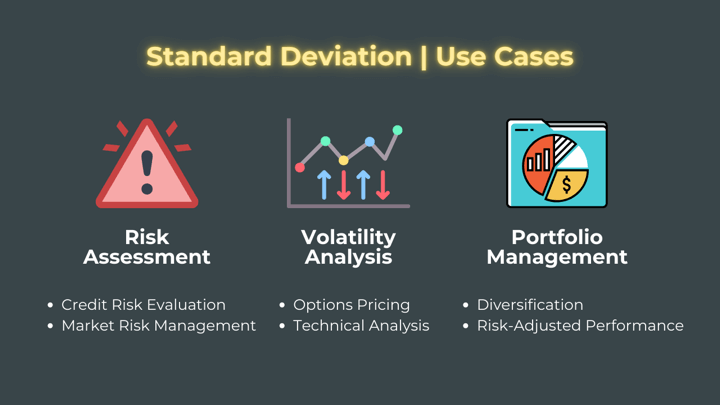
Here are the use cases of standard deviation in risk assessment, volatility analysis, and portfolio management:
Let us now head to the essential components concerning standard deviation that are used in the calculation part.
Let us now see the essential components that are required for calculating standard deviation in the trading domain.
These are:

The unit of standard deviation would be the same as the unit of our data. This makes it easier to interpret compared to the variance. In the next section, we do a detailed comparison between these two measures of dispersion.
As we can see, by its very construction, the variance is in the square of the original unit. This means that if we are dealing with distances in kilometres, the unit of variance would be in square kilometres.
Now, square kilometres may be easy to visualise as a unit, but what about year2 or IQ2, if we are working with ages or IQs of a group? They are harder to interpret. Hence, it makes sense to use a measure that can be comparable to the data on the same scale/units, like the standard deviation.
Standard deviation is calculated as the square root of variance. It has the same unit as our data and this makes it easy to use and interpret. For example, consider a scenario where we are looking at a dataset of the heights of residents of a neighbourhood. Assume that the heights are normally distributed with a mean of 165 cm and a standard deviation of 5 cm.
We know that for a normal distribution,

Thus, we can conclude that the height of almost 68% of the residents would lie between one standard deviation from the mean, i.e., between 160 cm (mean – sd) and 170 cm (mean + sd).⁽³⁾
When calculating the standard deviation of a population, we use the formula discussed above. However, we modify it slightly when dealing with a sample instead.
This is because the sample is much smaller compared to the entire population. To account for differences in a randomly selected sample and the entire population, we ‘unbias’ the calculation by using ‘(n-1)’ instead of ‘n’ in the denominator of equation 1. This is referred to as Bessel’s correction.⁽⁴⁾
Thus, we use the following formula to calculate the sample standard deviation (s).

Stay tuned for the next installment to learn about standard deviation in trading as a measure of volatility.
Author: Chainika Thakar (Originally written by Ashutosh Dave and Udisha Alok)
Originally posted on QuantInsti blog.
Information posted on IBKR Campus that is provided by third-parties does NOT constitute a recommendation that you should contract for the services of that third party. Third-party participants who contribute to IBKR Campus are independent of Interactive Brokers and Interactive Brokers does not make any representations or warranties concerning the services offered, their past or future performance, or the accuracy of the information provided by the third party. Past performance is no guarantee of future results.
This material is from QuantInsti and is being posted with its permission. The views expressed in this material are solely those of the author and/or QuantInsti and Interactive Brokers is not endorsing or recommending any investment or trading discussed in the material. This material is not and should not be construed as an offer to buy or sell any security. It should not be construed as research or investment advice or a recommendation to buy, sell or hold any security or commodity. This material does not and is not intended to take into account the particular financial conditions, investment objectives or requirements of individual customers. Before acting on this material, you should consider whether it is suitable for your particular circumstances and, as necessary, seek professional advice.
Options involve risk and are not suitable for all investors. For information on the uses and risks of options, you can obtain a copy of the Options Clearing Corporation risk disclosure document titled Characteristics and Risks of Standardized Options by going to the following link ibkr.com/occ. Multiple leg strategies, including spreads, will incur multiple transaction costs.


Join The Conversation
For specific platform feedback and suggestions, please submit it directly to our team using these instructions.
If you have an account-specific question or concern, please reach out to Client Services.
We encourage you to look through our FAQs before posting. Your question may already be covered!