
- Solve real problems with our hands-on interface
- Progress from basic puts and calls to advanced strategies
Interactive Options Course

Posted April 18, 2023 at 10:50 am
Excerpt
The process of trading with a portfolio of stocks requires a number of steps like stock selection, the formation of strategies while creating a portfolio and so on. In this blog, we will cover all about portfolio analysis, the tools to compute risks over returns and the relationship between the risks and returns.
A portfolio is a collection of financial instruments such as stocks, bonds, cash equivalents, or funds held by an individual, investment company or financial institution. An investment portfolio can be regarded as a pie which is divided into various parts, each representing a financial instrument with the objective of achieving a particular level of risk and return.
Investors should construct a portfolio according to the investment objectives, risk tolerance, and time frame.
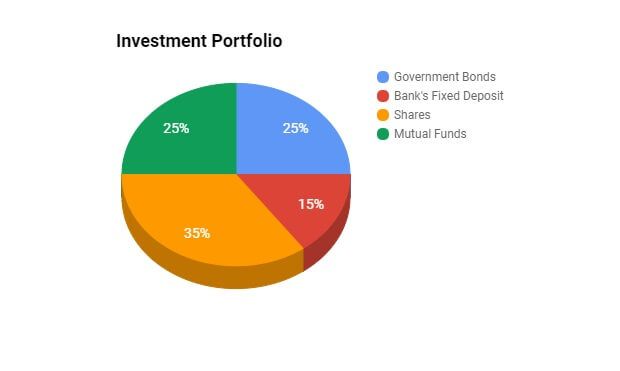
Example: Suppose you want to invest $100,000 in the financial market then your portfolio may look like this.
| No. | Investor’s portfolio | Investment | Percentage | Security | Returns |
| 1. | Government Bonds | $25,000 | 25% | High | Low |
| 2. | Banks’ Fixed Deposits | $15,000 | 15% | High | Average |
| 3. | Shares | $35,000 | 35% | Low | High |
| 4. | Mutual Funds | $25,000 | 25% | Average | Average |
| Total | 1,00,000 | 100% |
Portfolio analysis is one of the areas of investment management that enables market participants to analyze and assess the performance of a portfolio (equities, bonds, alternative investments, etc.).
Portfolio analysis is intended to measure performance on a relative and absolute basis along with its associated risks.
There are some tools or calculation ratios to be used for conducting the portfolio analysis. These tools are:
It calculates the overall return during the investment holding period.
Holding Period Return ={(Ending Value–Beginning Value)+Dividends Received}/Beginning Value
It calculates the average returns of the overall portfolio.
ArithmeticMean = (R1+R2+R3+……+Rn)/n
where,
R = Returns of Individual Assets
It calculates the excess returns over and above the risk-free return per unit of portfolio risk.
Sharpe Ratio Formula = (Expected Return – Risk-Free rate of return) / Standard Deviation
It calculates the difference between the actual portfolio returns and the expected returns.
Alpha of portfolio = Actual rate of return of portfolio – Expected Rate of Return on Portfolio
It calculates the standard deviation of the excess return concerning the benchmark rate of return.
TrackingErrorFormula=Rp−Rb
where,Rp=ReturnofPortfolio,Rb=ReturnonBenchmark
It calculates the success of the active investment manager’s strategy by calculating excess returns and dividing it by the tracking error.
InformationratioFormula=(Rp–Rb)/Trackingerror
where,Rp=ReturnofPortfolio,Rb=ReturnonBenchmark
It calculates the excess return over and above the risk-free return per unit of negative asset returns.
SortinoRatioFormula=(Rp–Rf)/σd
where,Rp=ReturnofPortfolio,Rf=Risk−FreeRate,σd=standarddeviationofnegativeassetreturns
Originally posted on QuantInsti. Visit the blog read more on this topic.
Information posted on IBKR Campus that is provided by third-parties does NOT constitute a recommendation that you should contract for the services of that third party. Third-party participants who contribute to IBKR Campus are independent of Interactive Brokers and Interactive Brokers does not make any representations or warranties concerning the services offered, their past or future performance, or the accuracy of the information provided by the third party. Past performance is no guarantee of future results.
This material is from QuantInsti and is being posted with its permission. The views expressed in this material are solely those of the author and/or QuantInsti and Interactive Brokers is not endorsing or recommending any investment or trading discussed in the material. This material is not and should not be construed as an offer to buy or sell any security. It should not be construed as research or investment advice or a recommendation to buy, sell or hold any security or commodity. This material does not and is not intended to take into account the particular financial conditions, investment objectives or requirements of individual customers. Before acting on this material, you should consider whether it is suitable for your particular circumstances and, as necessary, seek professional advice.


Join The Conversation
For specific platform feedback and suggestions, please submit it directly to our team using these instructions.
If you have an account-specific question or concern, please reach out to Client Services.
We encourage you to look through our FAQs before posting. Your question may already be covered!