
- Solve real problems with our hands-on interface
- Progress from basic puts and calls to advanced strategies
Interactive Options Course
Posted September 16, 2026 at 11:00 am
At meaningful lead times, ForecastEx has 21% to 25% lower forecast errors for daily high temperatures than even the next-best alternative among twenty.
In March, and in an April update, I published articles showing that the daily high-temperature forecasts implied by ForecastEx prediction markets were systematically better than those from the most comparable National Weather Service product.
Those were preliminary results, but if they held, they would be significant. However, at the time of my last update, the data covered only five weeks, compared ForecastEx with only a single conventional system, and used a single metric: the average error of the market’s central estimate of the daily high.
Today I report that the conclusions from those articles hold up over seven months rather than five weeks, when the comparison is extended to 19 additional forecasting systems, and when skill is assessed from several additional angles.
ForecastEx has the lowest average error of the eighteen systems that issue a single temperature, at nearly every lead time, and its full price distribution scores better than the four systems that publish ensemble members. The comparison set now includes an AI forecasting system from the European Centre for Medium-Range Weather Forecasts, the class of model that has drawn the most attention in weather forecasting over the past couple of years.
Every figure in this article is a static version of a figure on the live site I built and maintain, which updates daily with the day’s results once temperatures are recorded.
A more complete analysis, including the statistical tests behind every comparison shown here, is presented in a working paper under development.
Backing up for a moment, prediction markets let participants take financial positions based on their expectations of well-defined event outcomes, where a contract pays $1 if a specific outcome occurs and $0 otherwise. ForecastEx lists daily temperature markets where the question can be phrased as “Will today’s high temperature at a given location exceed X°F?” A contract trading at $0.70 indicates a 70% probability (“Yes” = $0.70) that it will.
When evaluating whether prediction markets might outperform traditional daily weather forecasts, it is important to emphasize that prediction markets are not substitutes for standard forecasts. Rather, they sit downstream of them, using conventional forecast information as an input but aggregating and converting that input into probabilities via the judgment of participants. Further, prediction markets with high activity update continuously, unlike conventional weather forecasts, which update much less frequently, usually on multi-hourly schedules.
The structure of prediction markets strongly promotes accuracy because it directly rewards skill and directly penalizes inaccuracy. This creates a dual effect of attracting accurate individuals and systems into the market while deterring those who are inaccurate. People or systems that consistently make poor forecasts are heavily motivated to either improve or leave the market.
In this analysis, I compare ForecastEx’s skill with twenty alternative systems enumerated in the table below. These systems fall roughly into four categories: raw numerical weather prediction models, numerical weather prediction models with statistical corrections applied in post-processing, human-edited forecasts, and AI systems. Some systems forecast for a geographic footprint that includes the station used for settlement, while others target the station directly. There are both deterministic systems, which issue one temperature at each time, and probabilistic systems, which issue a spread of outcomes for each time.

Figure produced by Patrick Brown with Matplotlib. Grid spacing, update frequency, and data sources for each system are given on the live site and in the working paper.
When comparing ForecastEx’s forecast to deterministic systems, I take the temperature at which its ladder of strike prices crosses 50% as the central forecast value.
Every system is scored against the hourly temperature recorded in the airport ASOS station’s METAR reports, which ForecastEx uses to settle contracts.
ForecastEx’s daily high record runs from February 12 through the present, and its daily low record runs from May 6 to the present, across 24 US locations. I backfilled all alternative systems with reasonably accessible archives to maximize overlap with ForecastEx.
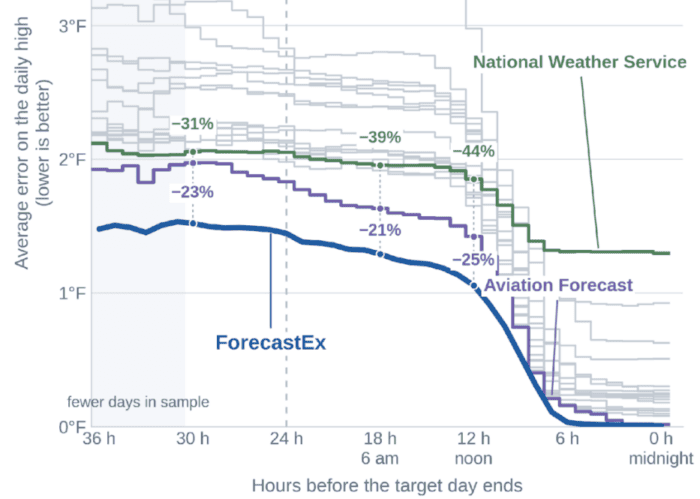
The figure below is an updated version of the main figure from the earlier articles. It shows the mean absolute error of the forecast, or the average gap in degrees between each system’s forecast of the daily high and the eventual observed high, as a function of the lead time (expressed as the hours remaining before the target day ends at local midnight). ForecastEx is the thick, continuous blue line, and each alternative system is a thin stepped line (stepped because it updates at most hourly, whereas ForecastEx is continuous).

Figure produced by Patrick Brown with Matplotlib. A live version, which includes daily lows and other samples, is here and updates each day as new data come in. The working paper reports the same comparison with bootstrap intervals and an adjustment for testing many systems at once.
ForecastEx has the lowest error at all 37 hourly lead times on daily highs, and at 35 of 37 on daily lows. The table below gives three lead times when people typically check the forecast.
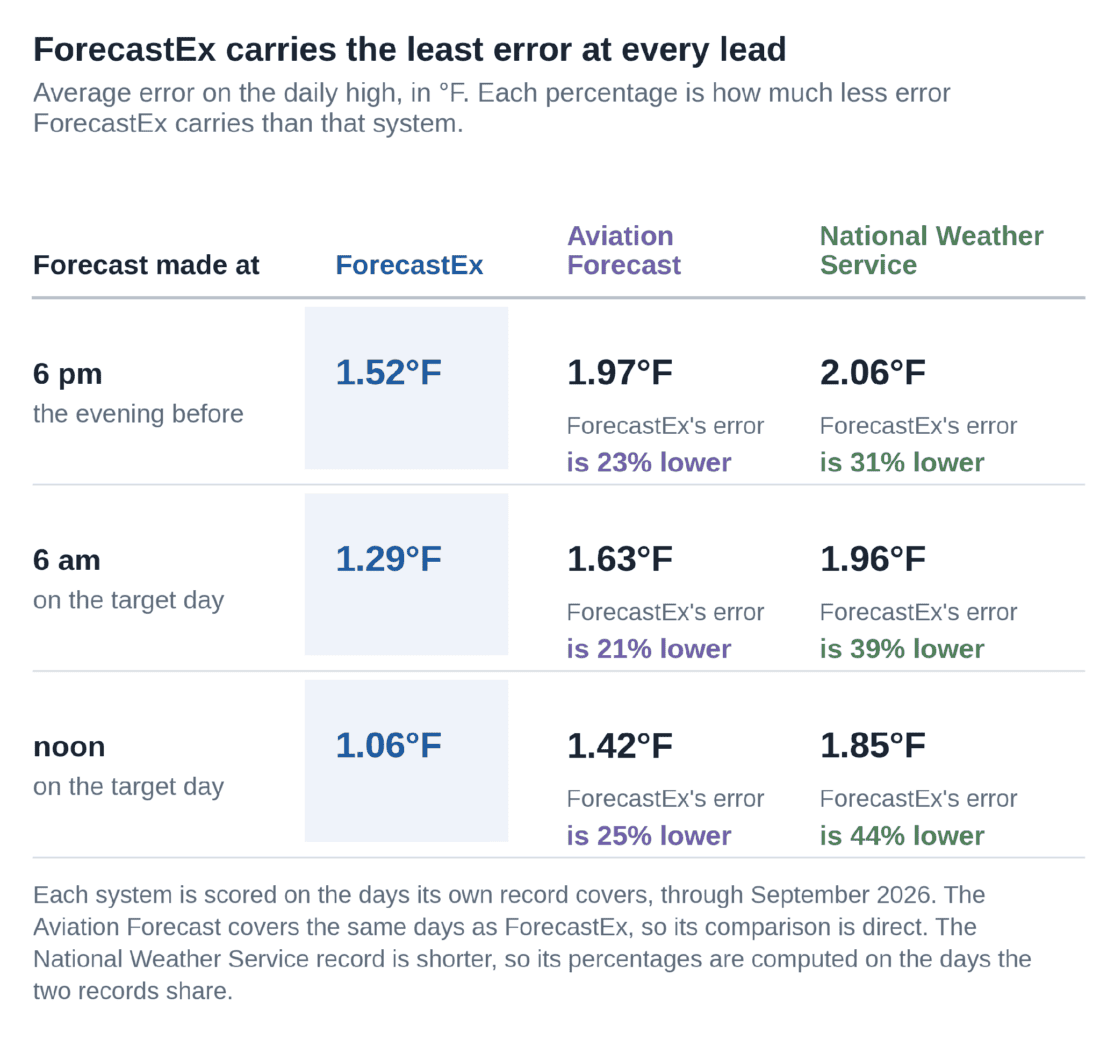
Figure produced by Patrick Brown with Matplotlib.
In both figures above, I highlight a comparison with the Aviation Forecast and the National Weather Service. This is because the Aviation Forecast is the most directly comparable system in the set: its statistical post-processing targets these specific airport stations rather than a grid cell containing them, so it is built to predict the same number the contracts settle on at the same hourly temporal resolution. The National Weather Service forecast is produced by professional meteorologists who already have most of the other systems on this list in front of them and whose job is to discriminate among them, so it represents the accuracy available when expert human judgment is applied to the same raw material the market sees.
The figure below shows how the margin varies by location. Over the morning of the target day, ForecastEx has the lowest morning error in all 405 station-and-system pairings with a record, and the difference is statistically resolved in 390 of them. That advantage ranges from 66% in San Francisco to 20% at Buckley Space Force Base near Denver against the National Weather Service, and from 40% in Jacksonville to 3% in Detroit against the Aviation Forecast.
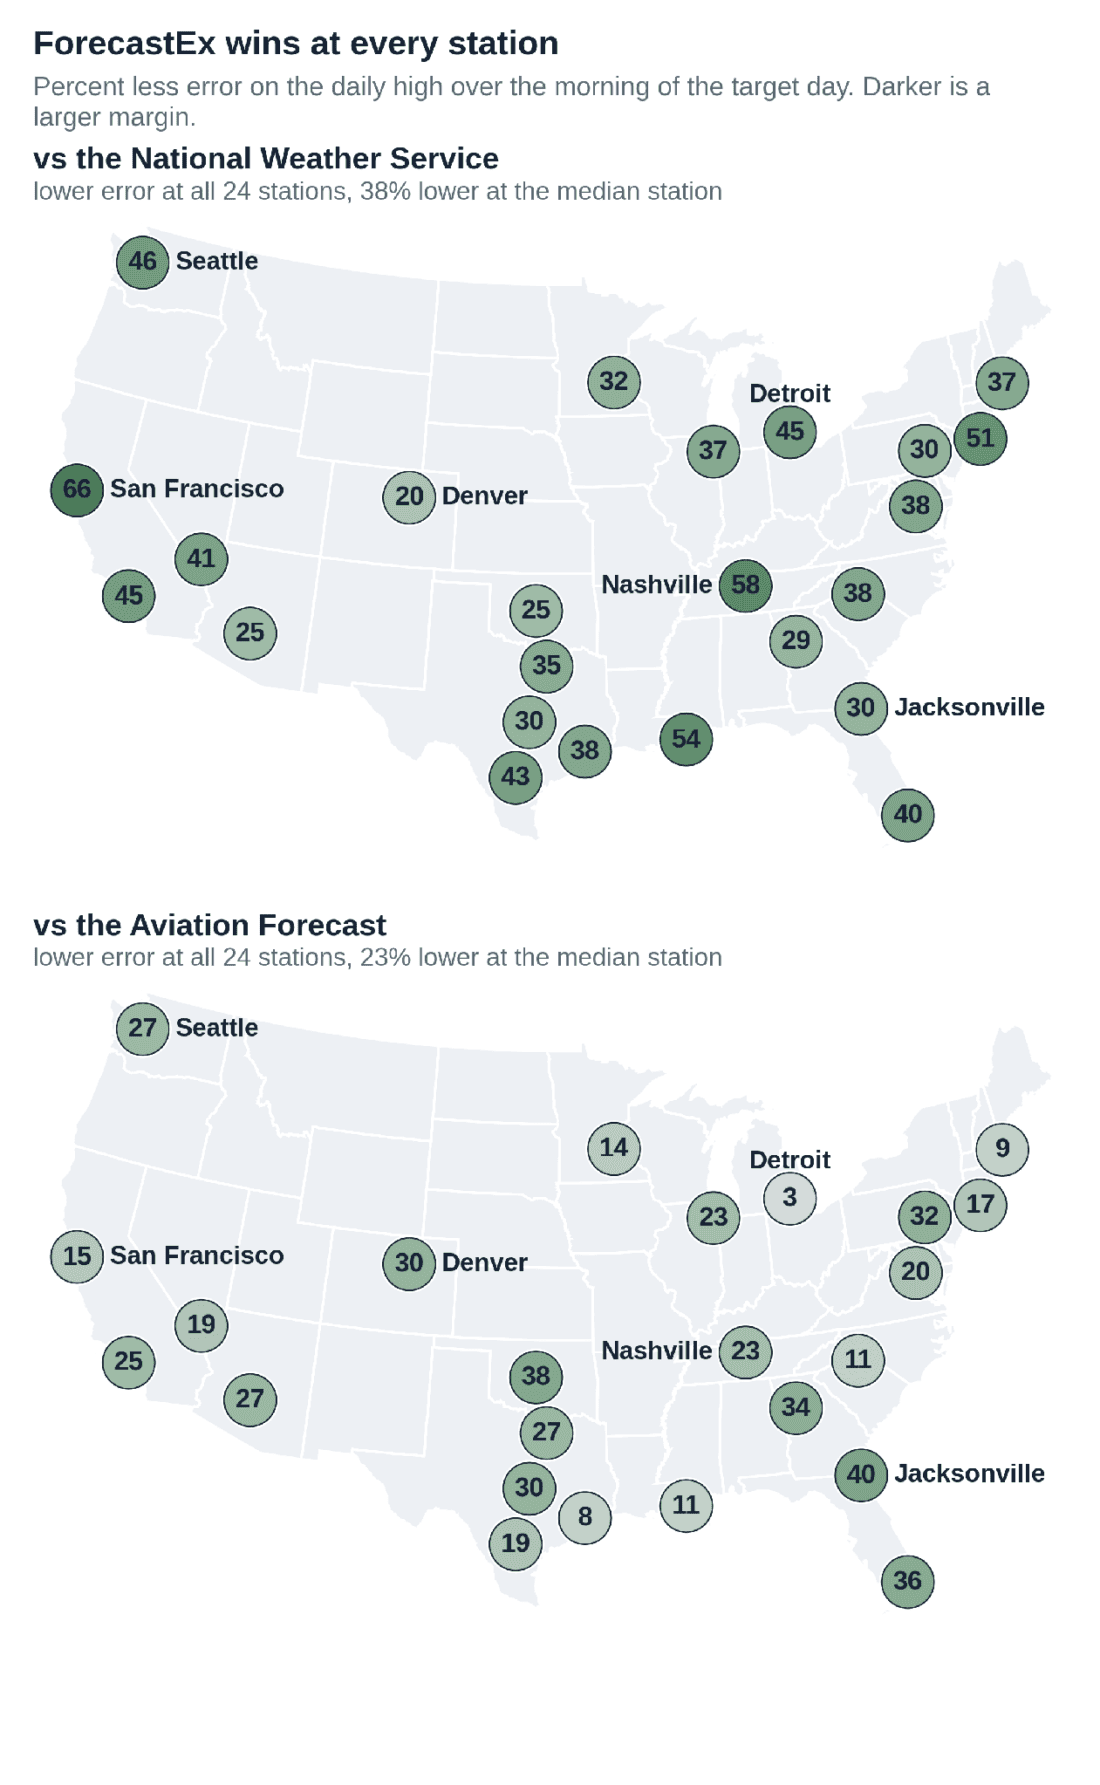
Figure produced by Patrick Brown with Matplotlib. The live city map here shows ForecastEx against any of the alternative systems, on highs or lows, over two time windows, and updates each day as new data come in. Further details and robustness checks are provided in the working paper.
Machine learning models trained on decades of reanalysis have moved from research to operations over the past couple of years, and they now tend to match or beat the physics-based models they were trained on, representing the forefront of weather forecasting. For example, Google DeepMind recently released its AI WeatherNext 3 to much fanfare.
I was not able to include WeatherNext 3 in this comparison because it was only released on September 3rd, but a comparable AI system is included. The European Centre for Medium-Range Weather Forecasts, whose numerical weather prediction model has been the most accurate global forecast for decades, runs the Artificial Intelligence Forecasting System (AIFS). According to Brightband’s Operational WeatherBench, an independent benchmark of operational forecasts, the skill gains of Google WeatherNext 3 over AIFS on North American surface temperature are marginal, and nowhere near large enough to suggest that WeatherNext 3 would beat ForecastEx in these comparisons.
The comparisons above use a single number from each system, but ForecastEx’s exceedance probabilities let you infer the full probability distribution of future temperatures at any point in time. This is valuable for assessing tail risks, and it also enables large payout multiples on the purchase of contracts that represent low-probability, high-impact extremes.
A probabilistic forecast is considered well-calibrated when events assigned a given probability occur at roughly that rate (e.g., contracts trading at “Yes” = $0.30 should pay out about 30% of the time). Two measures are used below, one that scores the whole distribution and one that checks calibration directly.
The figure below shows a measure of accuracy called the Continuous Ranked Probability Score, or CRPS. CRPS measures skill for an entire probability distribution and rewards concentrating probability closest to the eventual observation. Viewed this way, ForecastEx again has the lowest error among the four comparable alternatives at every lead time before the daily high is realized.
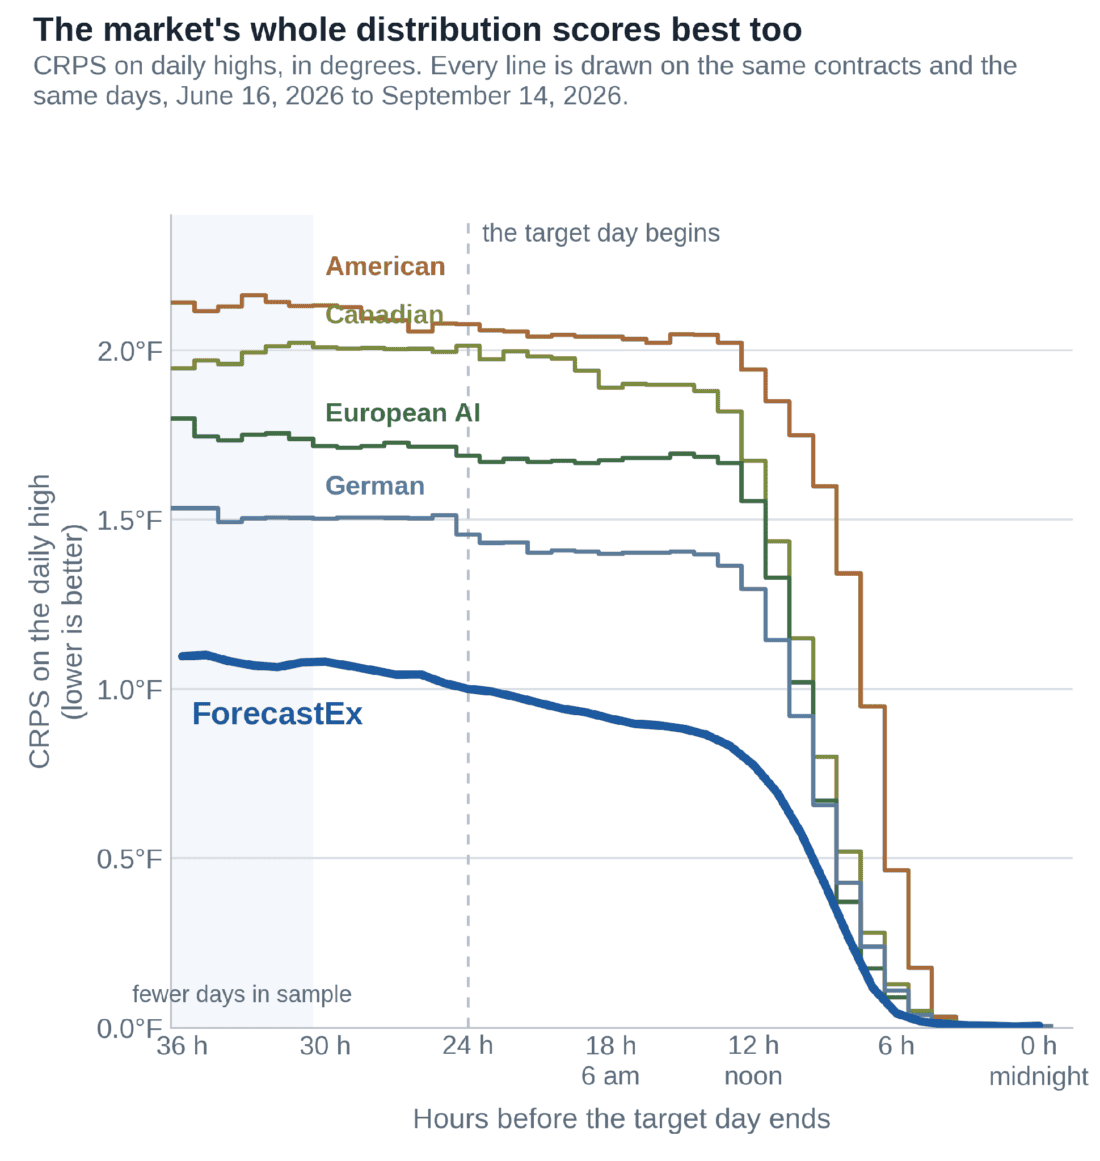
Figure produced by Patrick Brown with Matplotlib. The live version here covers daily lows as well, and updates each day as new data come in. The working paper also subjects these results to various robustness tests.
Another way to evaluate the entire probability distribution, which I will highlight here, is the reliability diagram, where forecasts are pooled into buckets (e.g., between 25% and 35%), and the frequency with which these forecasts came true is counted.
The figure below shows reliability diagrams for contracts priced 36 to 24 hours before the target day ends and 24 to 12 hours before, with daily highs in the top row and daily lows in the bottom row.
The horizontal axis on reliability diagrams shows the average probability in each bin, and the vertical axis shows the share of those contracts that paid out, so a perfectly calibrated forecast places every point on the dashed diagonal. A point above the diagonal means the forecast was too low, since the event happened more often than the forecast expected, and a point below means the opposite. The ForecastEx prediction market is represented by the shaded circles, and the four probabilistic systems are the thin lines.
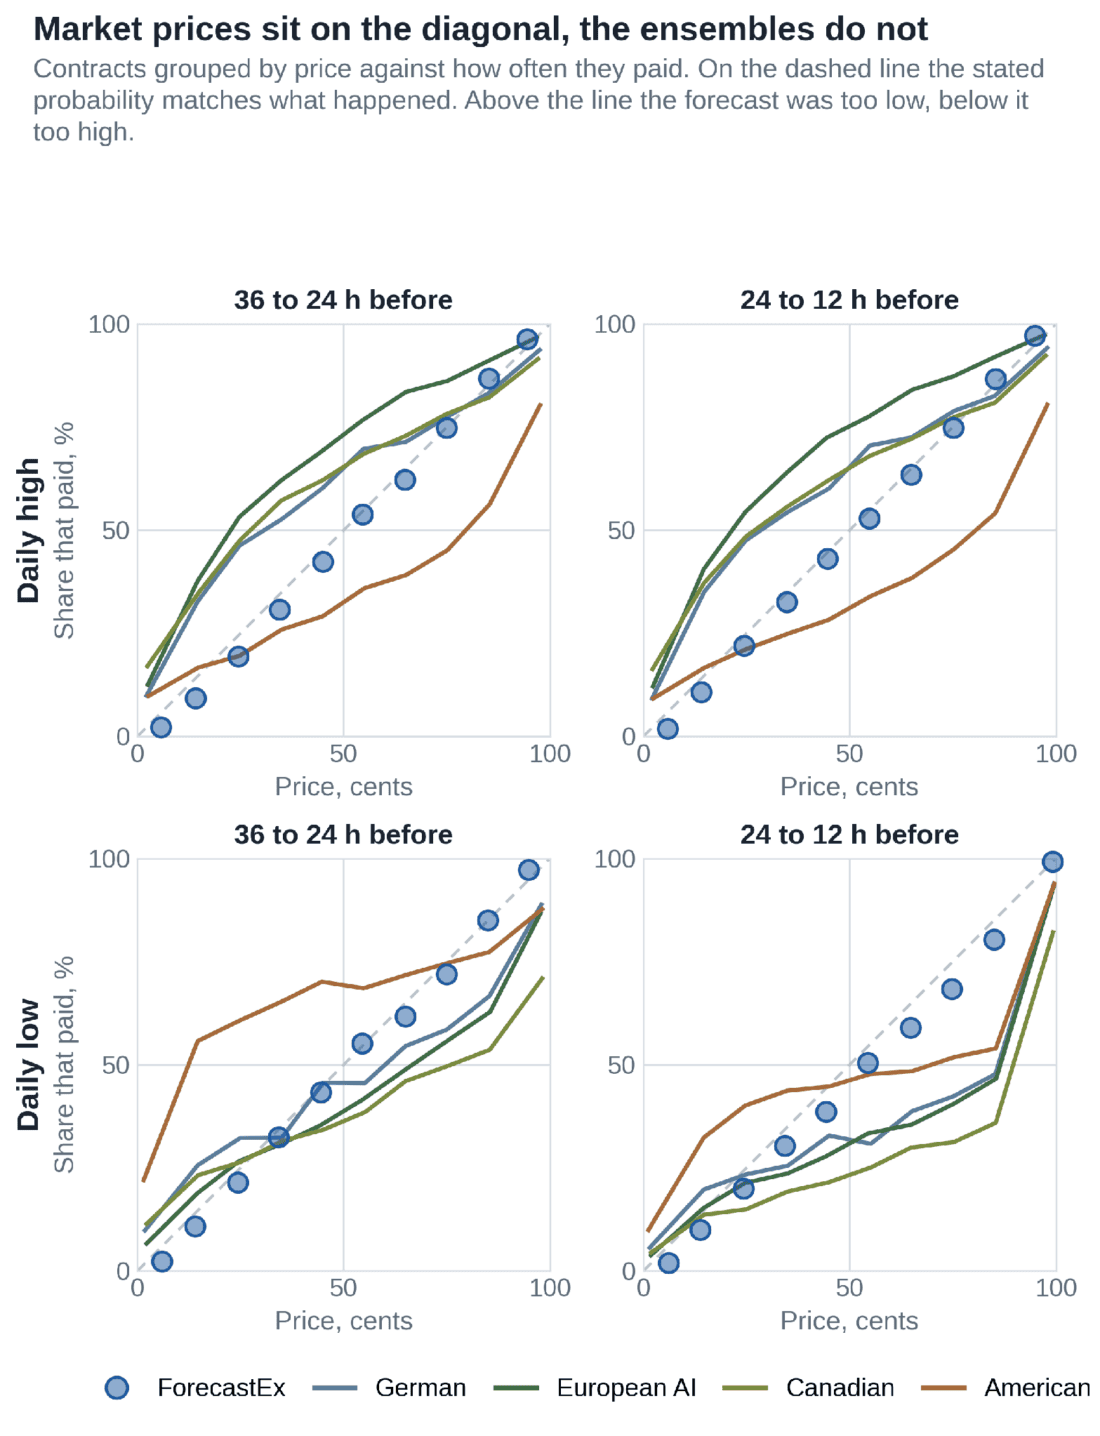
Figure produced by Patrick Brown with Matplotlib. The live calibration figure here covers more lead times and updates each day as new data come in. Further details and robustness checks are provided in the working paper.
The four alternative system ensemble curves sit noticeably off the diagonal. For example, the German, Canadian, and European AI models all tend to display a cool bias on daily highs, where exceedances occur systematically more often than predicted. The American ensemble shows the opposite problem on daily highs: it tends to be too warm, so exceedances occur less often than predicted.
In contrast, the ForecastEx prediction market points cluster near the diagonal in all four panels, indicating much better calibration than the alternative systems.
Daily weather forecasting is one of the most mature and scientifically principled fields in science and industry, and conventional forecasting systems sit at the frontier of applied physics, statistics, and computer science. Thus, they should not be seen as a target ripe for a novel forecasting system to improve upon. Despite the formidable challenge, accumulating evidence indicates that the ForecastEx prediction markets are doing just that.
Since February, ForecastEx’s daily temperature markets have had lower average error than the operational models of most of the world’s major forecasting centers, their statistical post-processing, an AI forecasting system at virtual parity with the most publicized one, and the National Weather Service’s own guidance, at nearly every lead time and, for daily highs, at every station. ForecastEx prices also behaved like well-calibrated probabilities and scored better than the probabilities available from the systems that publish an ensemble spread, both as those ensembles are issued and after they are statistically corrected.
This is consistent with the mechanism described above, in which the market takes conventional forecasts and observations as inputs and aggregates them, through participants with a financial stake in being correct, into a more accurate forecast.
The record spans late winter through mid-September, so the sample does not yet include a full winter. Temperature forecast errors are generally larger during the cold season, and whether the margin holds through a full winter is not yet testable.
The live site adds each day’s results as the temperatures are recorded, so the comparison will extend into the fall and winter. The working paper documents the methods, the robustness tests, and the cases where the market’s advantage is smaller or absent.
Patrick T. Brown is the Head of Climate Analytics at Interactive Brokers.
His work focuses on the information discovery and risk-transfer applications of prediction markets in weather, climate, and natural disasters.
He holds a PhD in Earth and Climate Science from Duke University, a master’s degree in Meteorology and Climate Science from San Jose State University, and a bachelor’s degree in atmospheric and oceanic sciences from the University of Wisconsin, Madison.
He is an adjunct faculty member (lecturer) in the Energy Policy and Climate Program at Johns Hopkins University and has conducted research at the Carnegie Institution at Stanford University, NASA JPL at Caltech, NASA Langley in Virginia, NASA Goddard in Washington, D.C., and NOAA’s GFDL at Princeton University. He has published scientific papers in Nature, PNAS, and Nature Climate Change, as well as many disciplinary journals, and his research and commentary have appeared in The New York Times, The Wall Street Journal, The Economist, CNBC, CNN, The BBC, The Washington Post, NPR, Newsweek, The Guardian, The Atlantic, Foreign Policy, and The Los Angeles Times, among other venues.
New to Prediction Markets?
Open a Prediction Markets AccountThe analysis in this material is provided for information only and is not and should not be construed as an offer to sell or the solicitation of an offer to buy any security. To the extent that this material discusses general market activity, industry or sector trends or other broad-based economic or political conditions, it should not be construed as research or investment advice. To the extent that it includes references to specific securities, commodities, currencies, or other instruments, those references do not constitute a recommendation by IBKR to buy, sell or hold such investments. This material does not and is not intended to take into account the particular financial conditions, investment objectives or requirements of individual customers. Before acting on this material, you should consider whether it is suitable for your particular circumstances and, as necessary, seek professional advice.
The views and opinions expressed herein are those of the author and do not necessarily reflect the views of Interactive Brokers, its affiliates, or its employees.
Interactive Brokers LLC is a CFTC-registered Futures Commission Merchant and a clearing member and affiliate of ForecastEx LLC (“ForecastEx”). ForecastEx is a CFTC-registered Designated Contract Market and Derivatives Clearing Organization. Interactive Brokers LLC provides access to ForecastEx Forecast Contracts for eligible customers. Interactive Brokers LLC does not make recommendations with respect to any products available on its platform, including those offered by ForecastEx.
Futures, event contracts, and forecast contracts are not suitable for all investors. Before trading these products, please read the CFTC Risk Disclosure. For a copy, visit our Warnings and Disclosures Page.
Event Contracts are only available to eligible clients, 21 years and older, of Interactive Brokers LLC, Interactive Brokers Canada Inc., Interactive Brokers Hong Kong Limited, Interactive Brokers Ireland Limited and Interactive Brokers Singapore Pte. Ltd. ForecastEx Forecast Contracts on US election results are only available to eligible US residents.
This is commentary on economic, political and/or market conditions within the meaning of CFTC Regulation 1.71, and is not meant provide sufficient information upon which to base a decision to enter into a derivatives transaction.
Displayed outcomes and prices are based on real-time market sentiment from ForecastEx LLC, an affiliate of IB LLC, as well as other CFTC-registered DCMs, including Kalshi and CME. For more information, see ibkr.com/realfex Note: Real-time market sentiment updates are only active during exchange open trading hours. Updates to current market sentiment for overnight activity will be reflected at the open on the next trading day. This information is not intended by IBKR as an opinion or likelihood of a potential outcome.
Related Articles


















Join The Conversation
For specific platform feedback and suggestions, please submit it directly to our team using these instructions.
If you have an account-specific question or concern, please reach out to Client Services.
We encourage you to look through our FAQs before posting. Your question may already be covered!